Sales Intelligence Hub | Interactive Power BI Dashboard
تفاصيل العمل
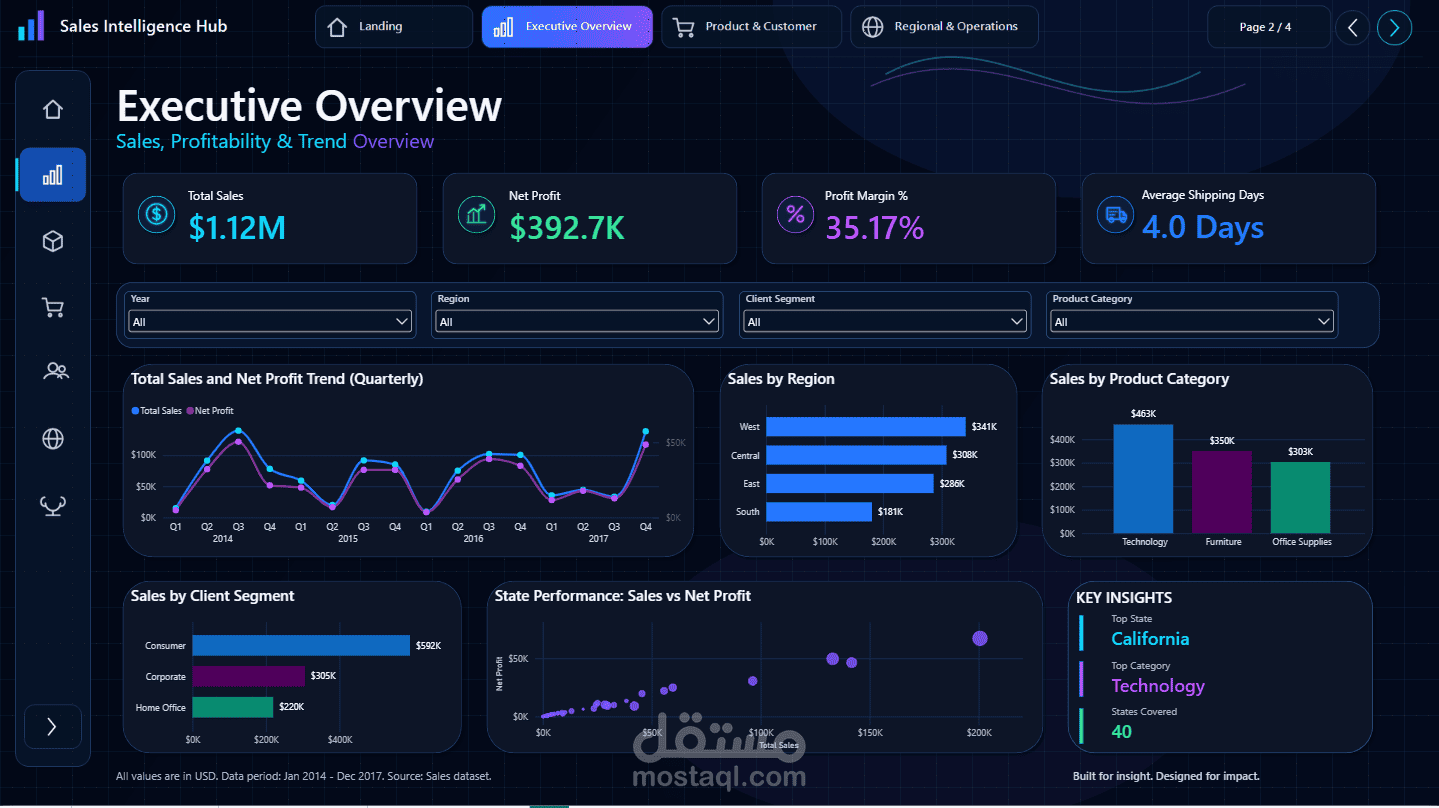
An end-to-end data analysis project that transforms sales data into interactive dashboards for exploring business performance.
I used SQL and Python for data preparation and analysis, Power Query for data transformation, and Power BI for data modeling and visualization. I created DAX measures to track sales, profitability, customer behavior, product performance, and operational metrics.
The report includes an Executive Overview, Product & Customer Intelligence, and Regional & Operations analysis. Interactive filters, navigation buttons, and tooltips allow users to move from high-level KPIs to detailed comparisons.
The dashboard helps users identify top-performing products, compare regional results, and explore trends that can support business decisions.
Tools: Power BI, SQL, Python, Power Query, and DAX.