Sales vs Budget Analysis
تفاصيل العمل
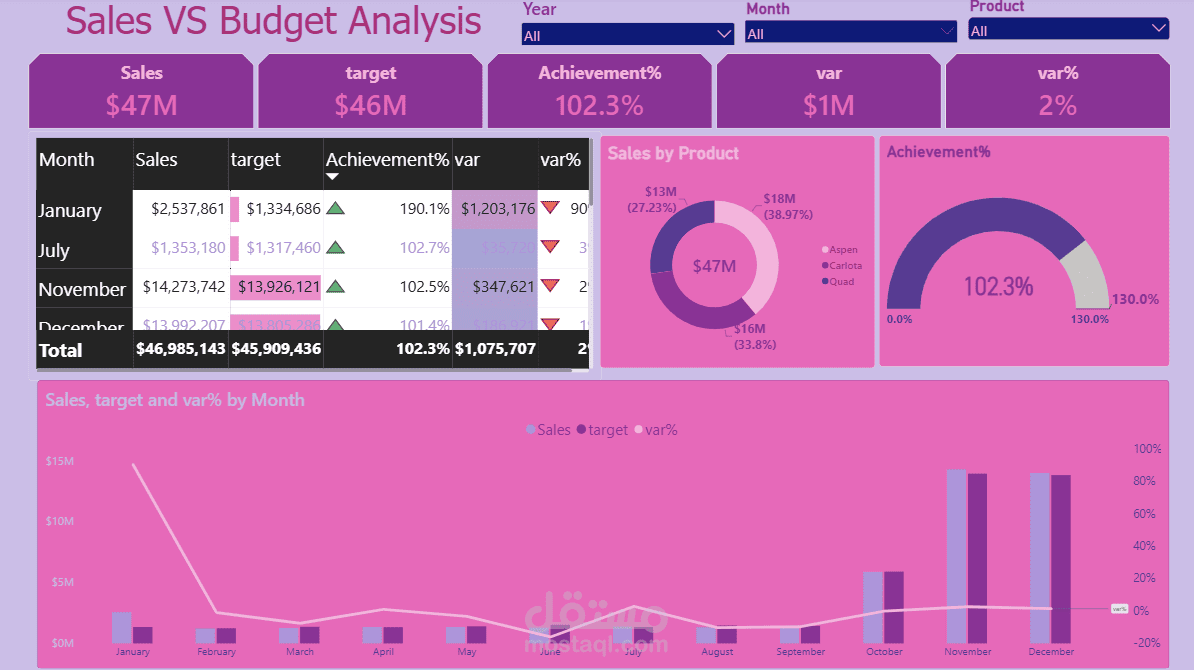
📊 Turning Sales Data into Meaningful Insights!
This dashboard provides a data-driven analysis of Sales vs. Budget, highlighting a total of $47M in sales and a positive $1M variance over budget.
It also visualizes monthly sales trends and product contributions, helping identify key performance drivers and support better business decisions.
#PowerBI #DataAnalysis #DataVisualization #BusinessIntelligence #SalesAnalysis #DataDriven