Sales Data analysis using power BI
تفاصيل العمل
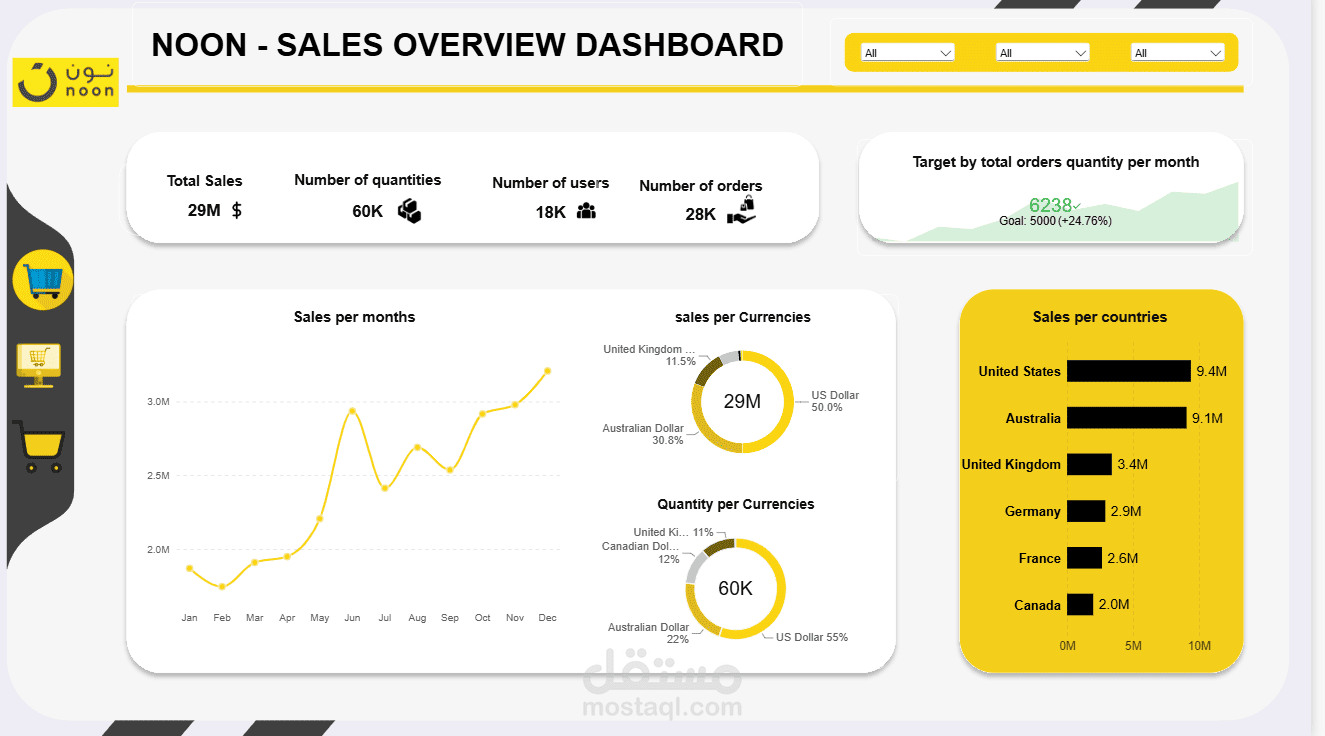
Noon Sales Analytics Dashboard | Power BI
A 4-page interactive Power BI dashboard built for an e-commerce business (styled on Noon.com), turning raw sales data into clear, decision-ready insights.
What it does:
Tracks Total Sales, Orders, Active Users, Net Profit & Profit Margin % at a glance
Shows sales trends over time with YTD comparisons
Breaks down performance by product and territory
Includes a decomposition tree to drill into what's driving the numbers
Fully interactive with slicers and a detailed, filterable sales table
Tools used: Power BI Desktop, DAX (custom KPIs & time-intelligence measures), star-schema data modeling, custom branded theme.
Ideal for clients who need: sales/executive dashboards, KPI tracking, or e-commerce performance reporting.