Excel Dashboard Creation Using Pivot Tables and Charts
تفاصيل العمل
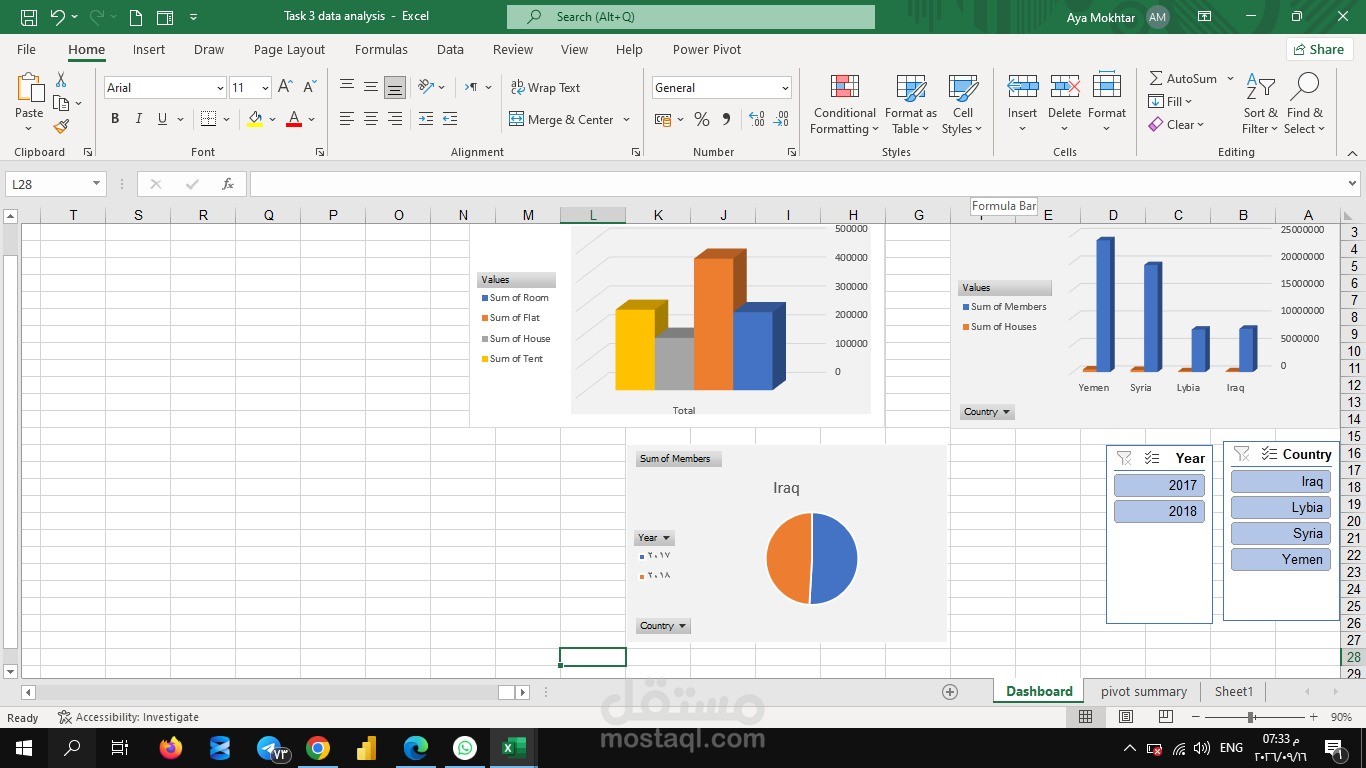
Designed and developed a professional, interactive Excel Dashboard utilizing Pivot Tables and Pivot Charts. The project includes data sorting, filtering by year and country, and visual representation of key metrics (Members and Houses) to deliver clear and structured data analysis