مُحاكي خوارزميات جدولة المعالج | CPU Scheduling Visualizer
تفاصيل العمل
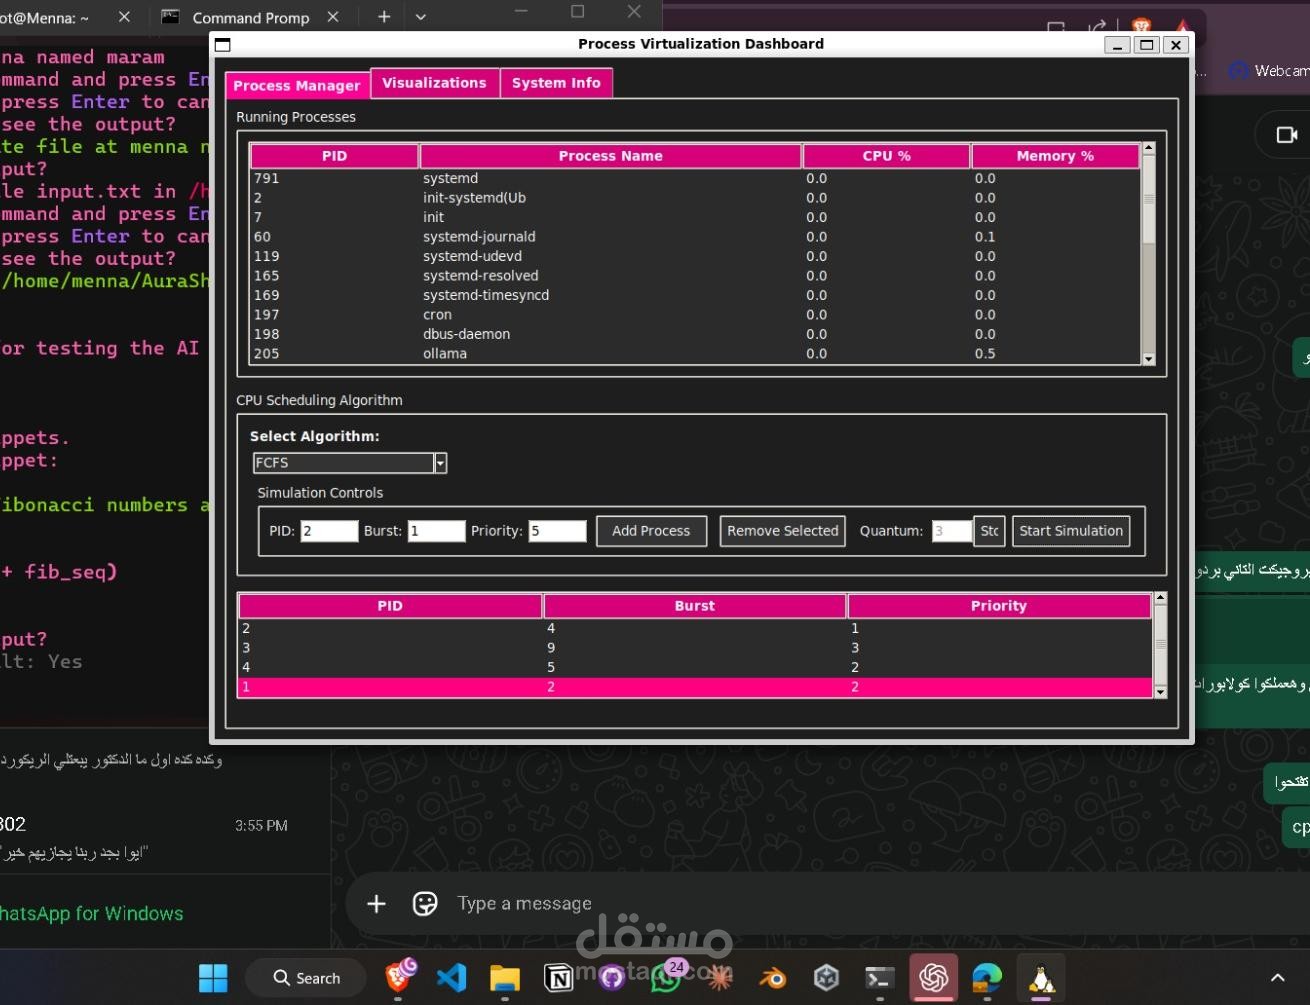
An interactive web application designed to visualize and compare Operating System CPU scheduling algorithms in real-time. It provides dynamic Gantt chart representations, automated performance metrics calculation, and side-by-side algorithmic comparisons.
Tech Stack:
- Programming Languages: JavaScript (ES6+), HTML5, CSS3
- Frameworks & Libraries: Bootstrap, Chart.js / Canvas API
- Core Concepts: Operating Systems, Process Scheduling, Data Structures & Algorithms
Key Features:
- Multiple Algorithm Support: Simulates algorithms including FCFS, SJF, SRTF, Round Robin, and Priority Scheduling.
- Dynamic Gantt Charts: Clear visual timeline representation of process execution over time.
- Automated Performance Metrics: Instant calculation of Waiting Time, Turnaround Time, Completion Time, and CPU Utilization.
- Customizable Inputs: Flexible interface to add processes with custom Arrival Times, Burst Times, and Priorities.
🎯 My Role:
- Designed and implemented the complete front-end user interface and layout.
- Developed core algorithm logic for process execution and scheduling metrics from scratch.
- Integrated interactive chart visualizations to render real-time Gantt charts dynamically.