town team dashboard
تفاصيل العمل
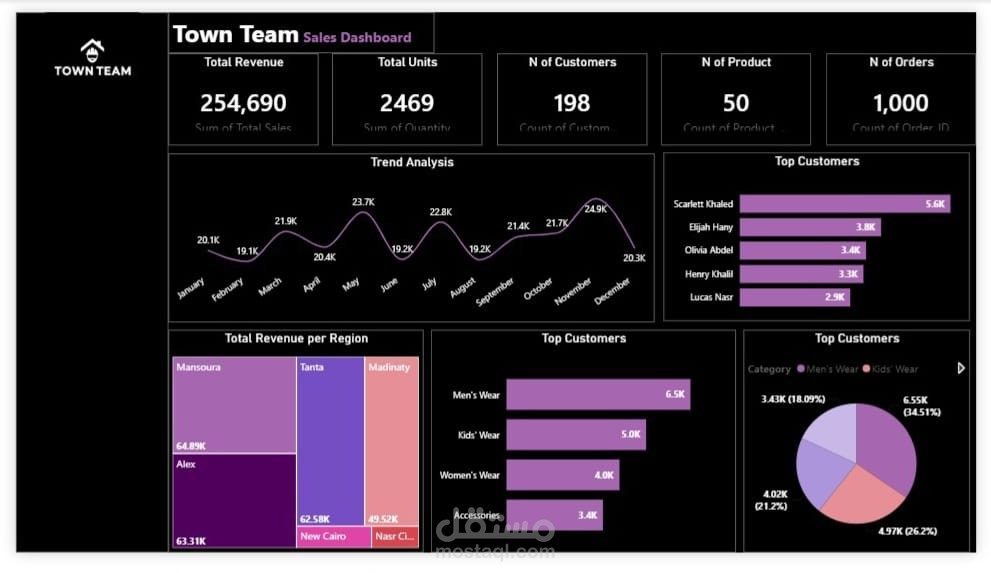
Project Overview
An interactive Power BI dashboard designed to track sales
metrics, analyze seasonal revenue trends, and evaluate
customer purchasing behavior across regions and product
categories.
Key Insights & Highlights
Core KPIs Tracked: Monitored 254.7K Total Revenue
across 1,000 Orders and 2,469 Units sold to 198 customers.
Regional Performance: Identified Mansoura (64.89K) and
Alexandria (63.31K) as the top revenue-generating regions.
Category Breakdown: Highlighted Men's Wear and Kids'
Wear as the primary drivers of total sales volume.
Seasonality & Trends: Analyzed monthly sales
fluctuations, discovering revenue peaks in May and
November.