C Company Sales Performance Dashboard – Power BI
تفاصيل العمل
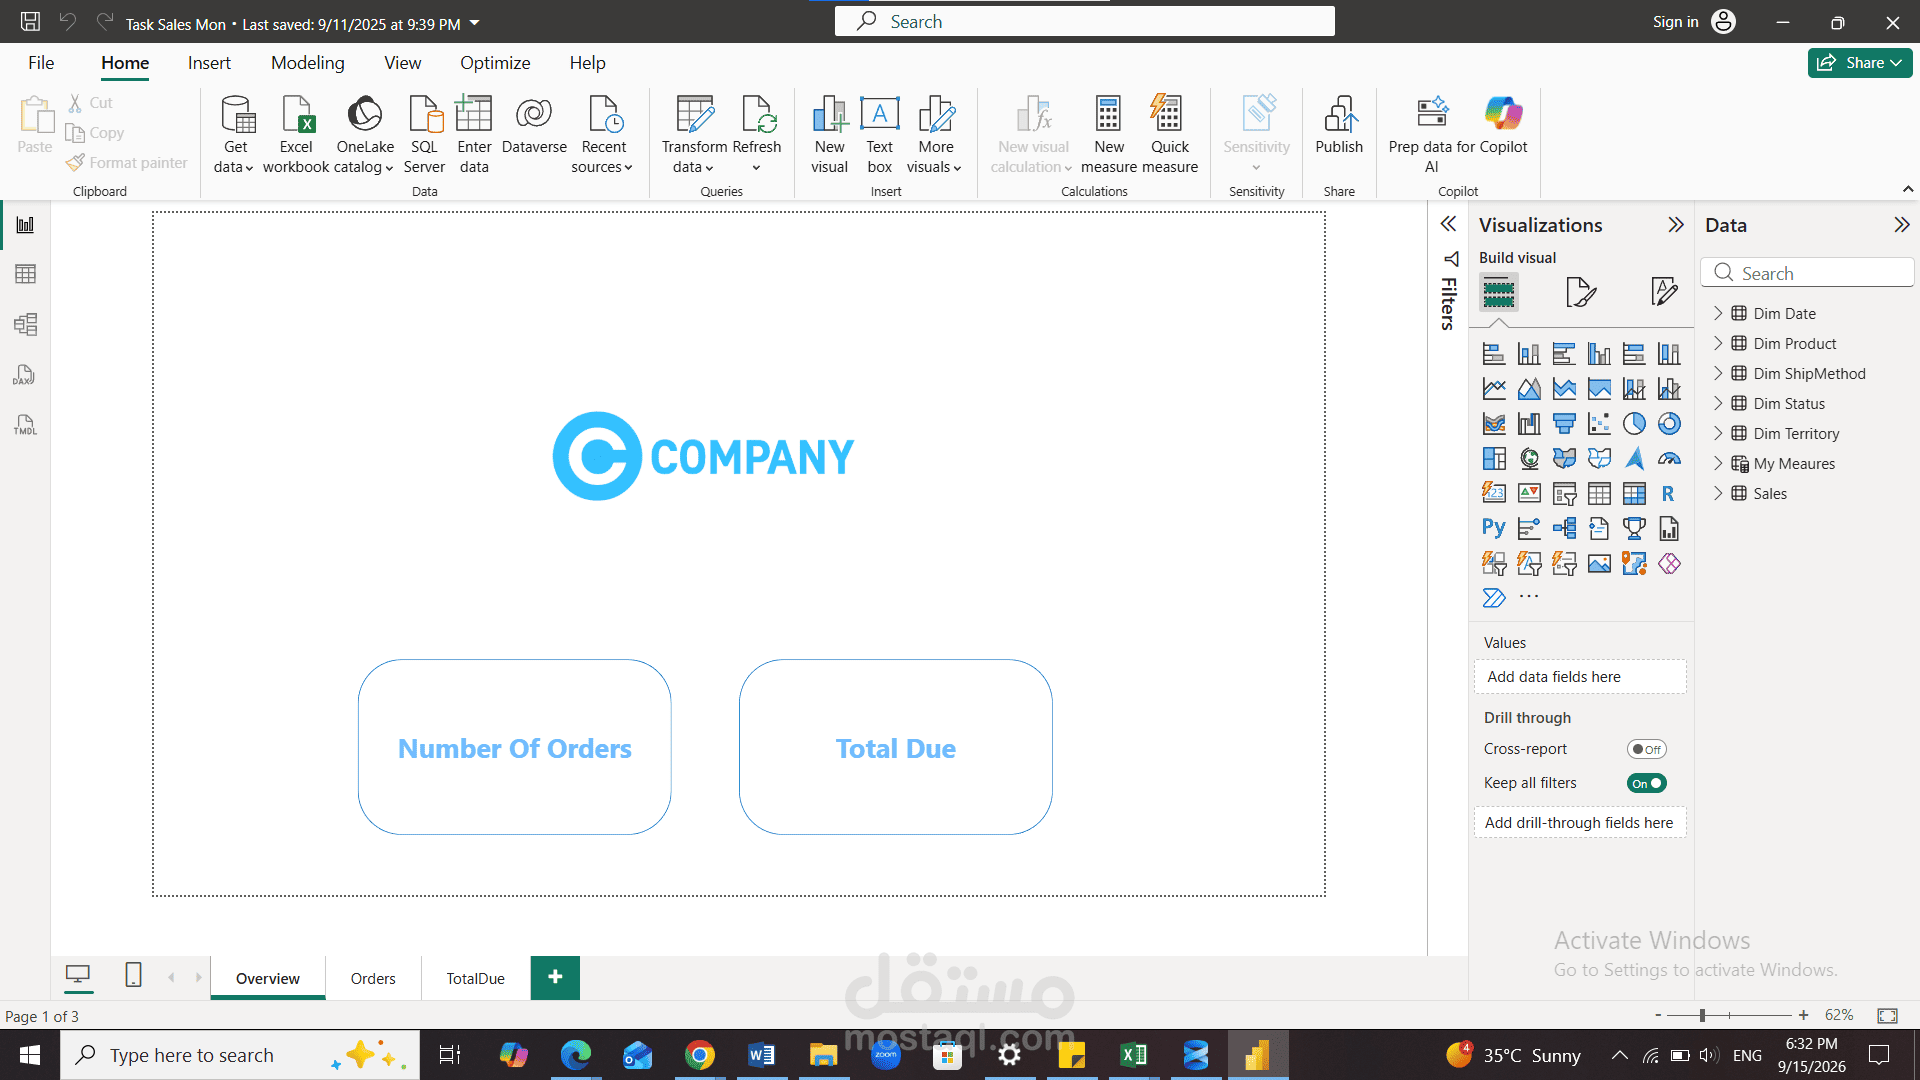
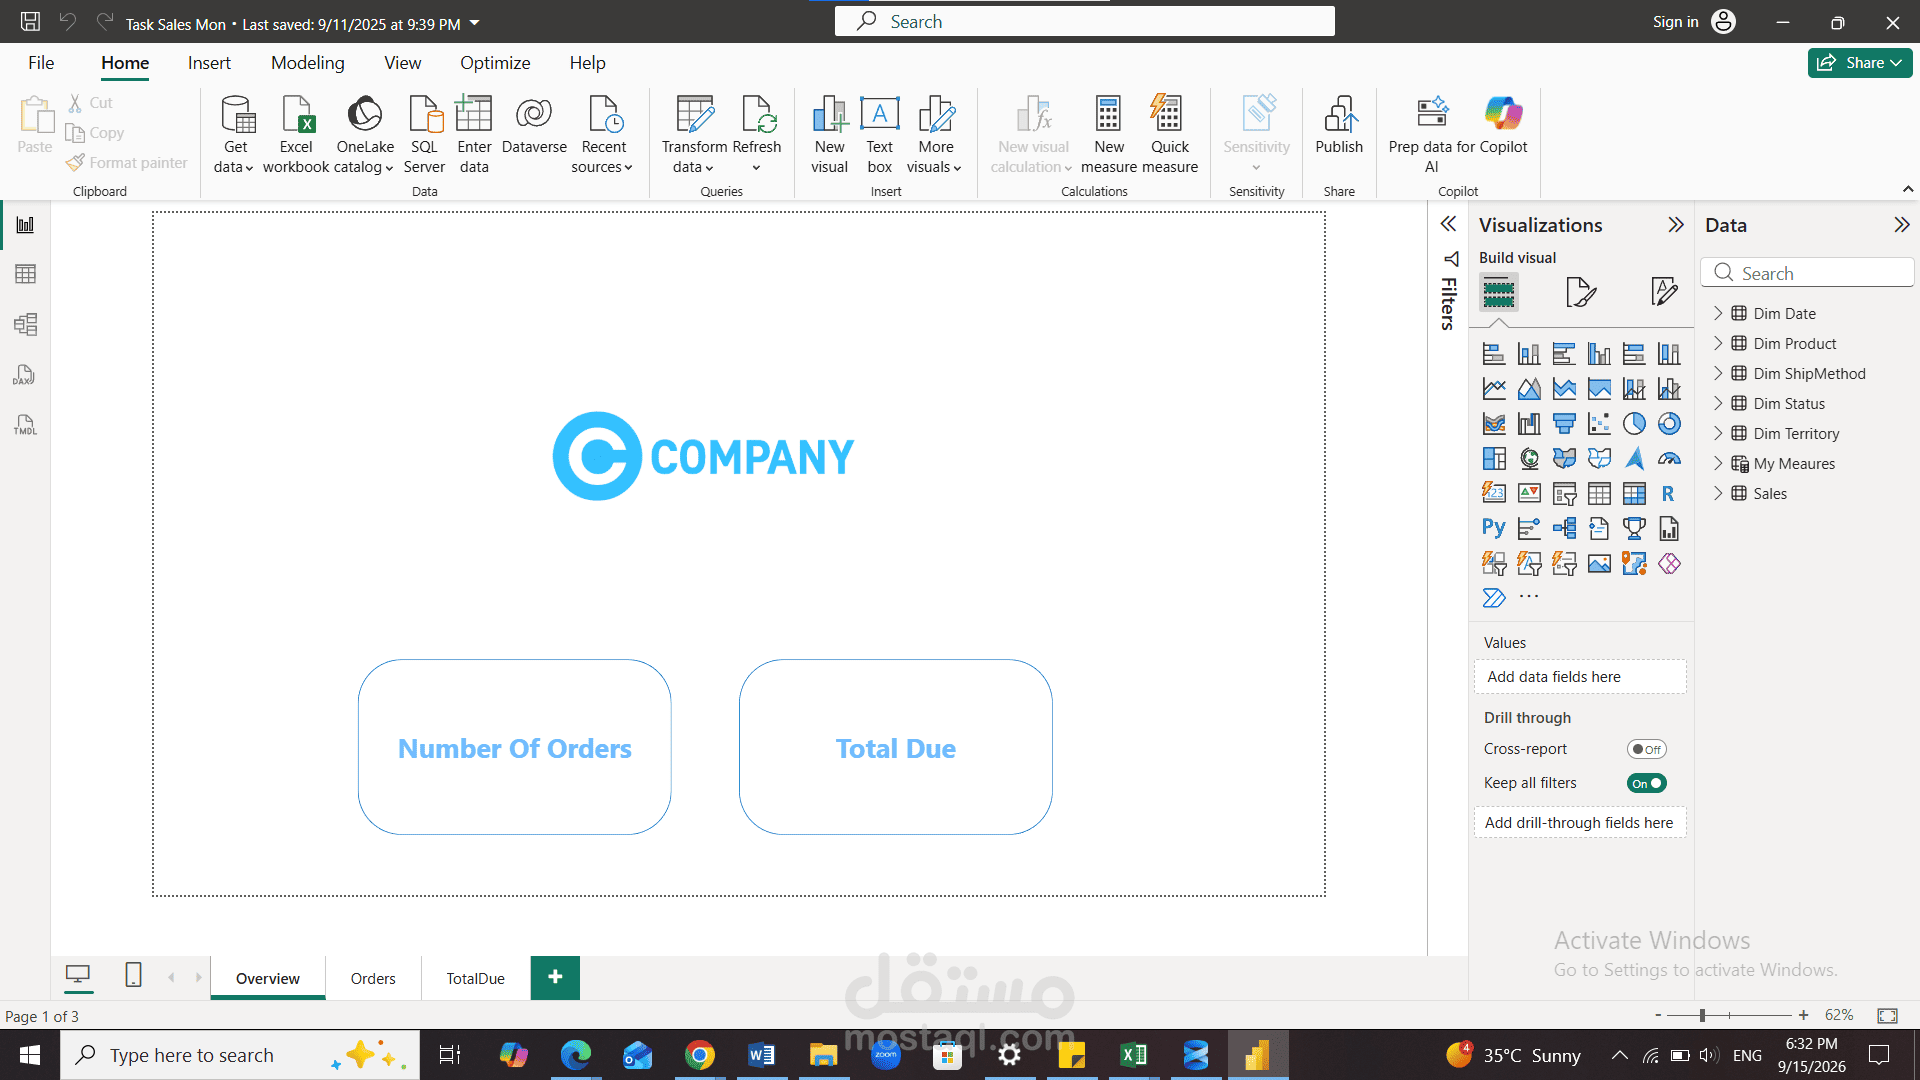
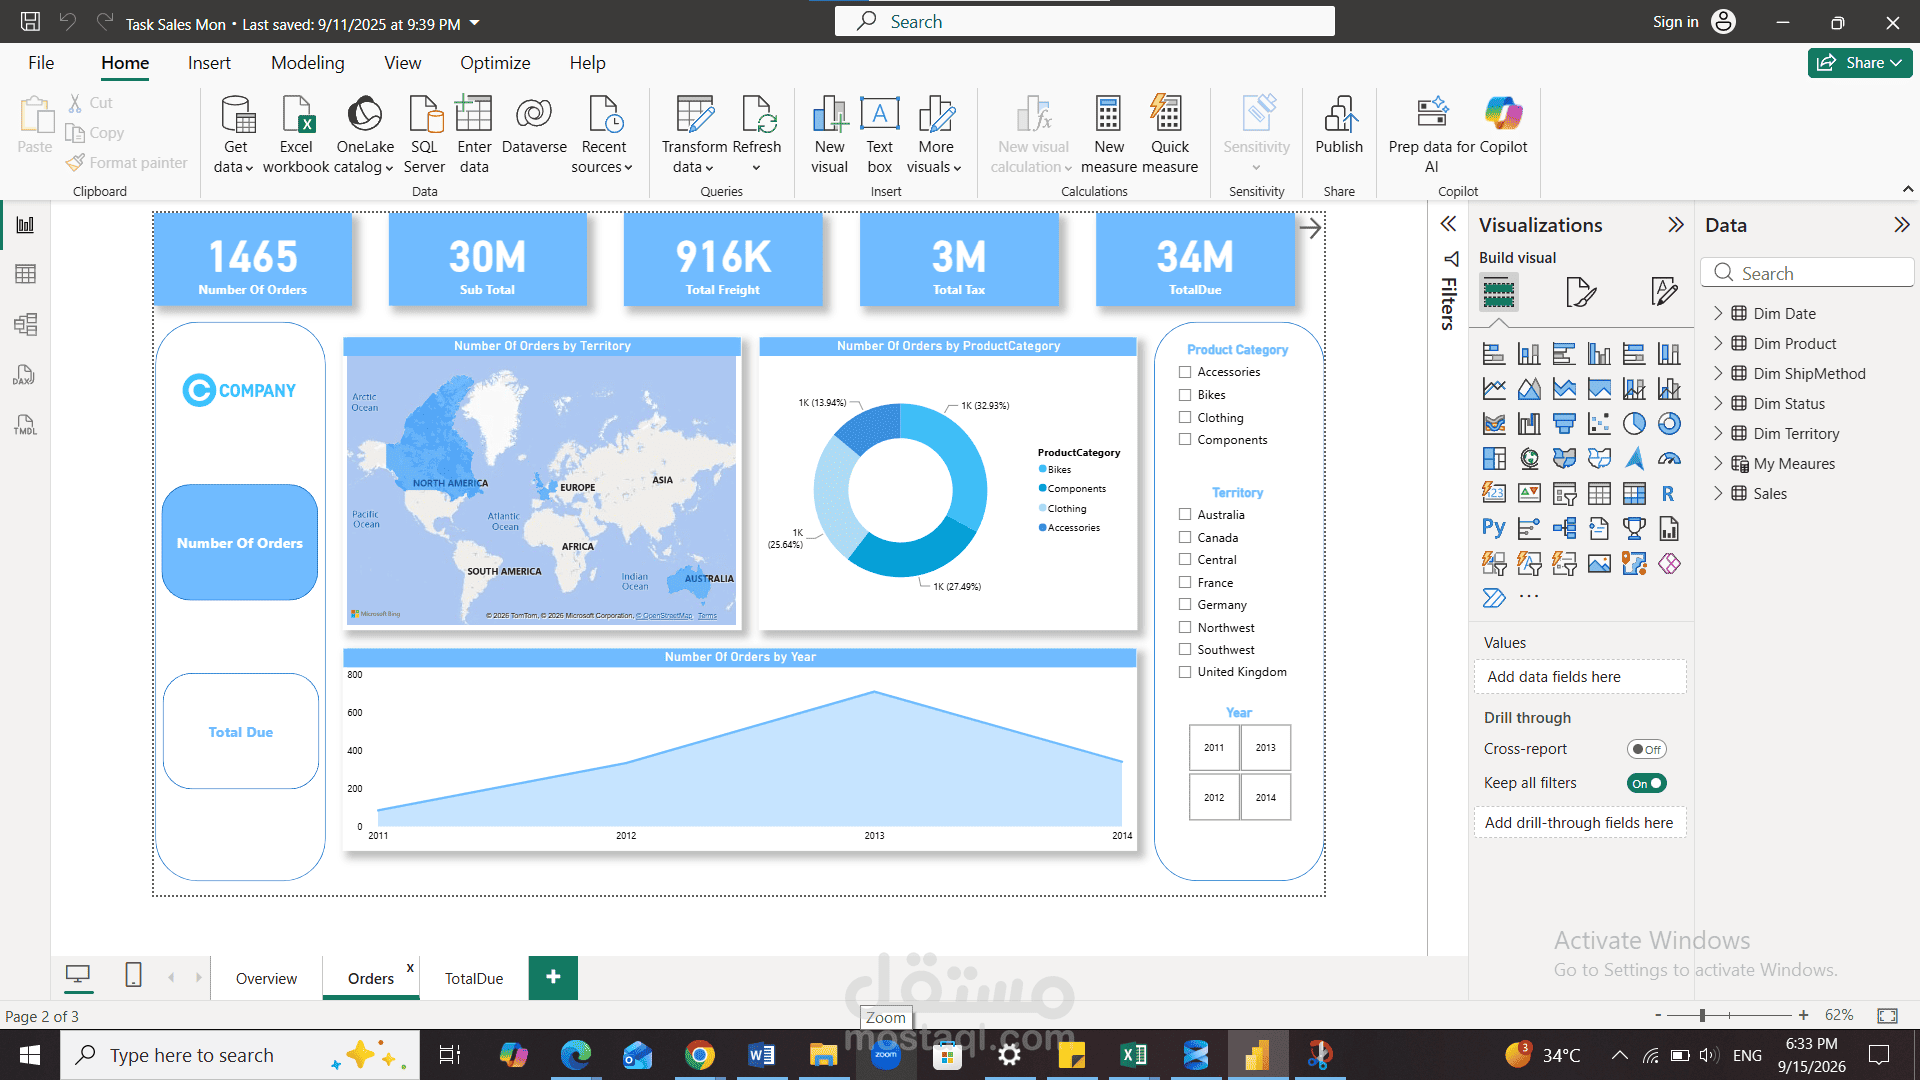
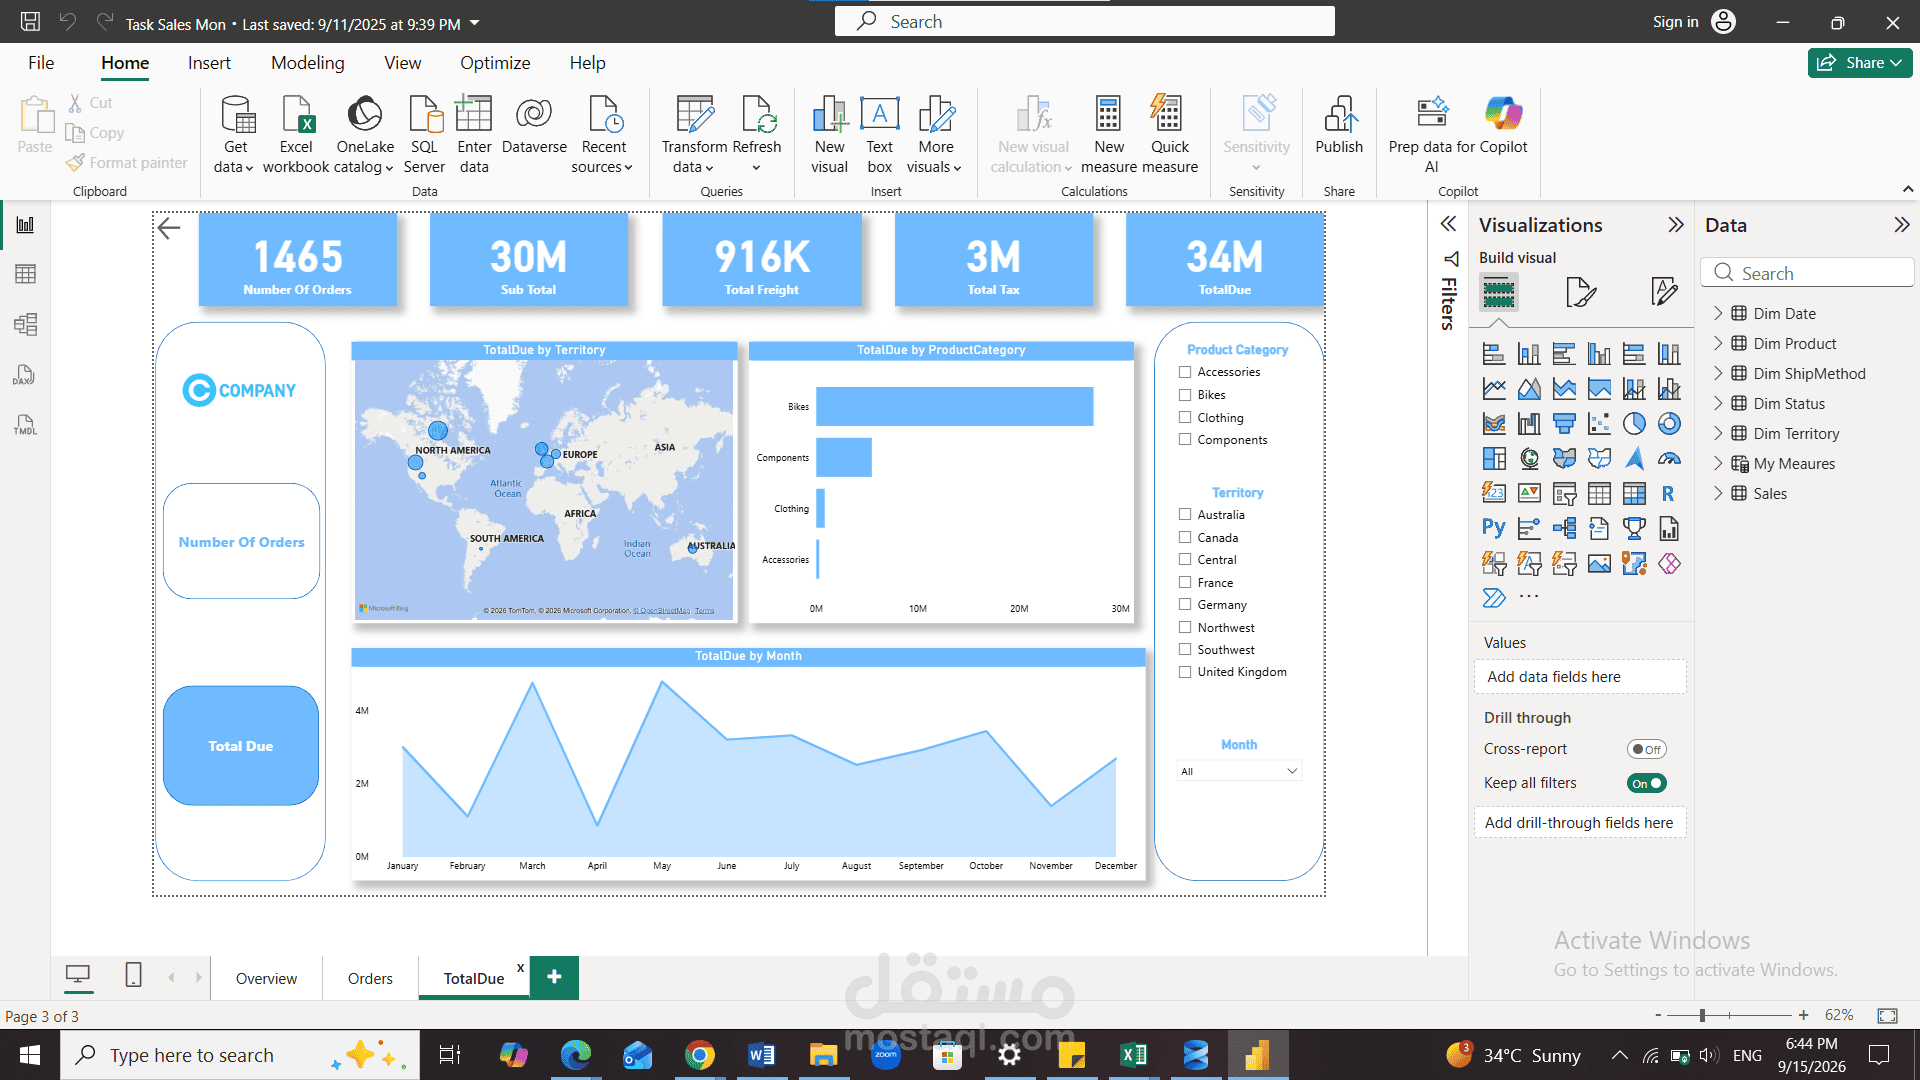
Developed a 3-page interactive Power BI dashboard for C Company to analyze sales performance. The dashboard includes an overview page with key KPIs such as Number of Orders and Total Due, an Orders Analysis page showing orders by territory, product category, and year, and a Total Due Analysis page analyzing total due by territory, product category, and month. Added interactive filters for Product Category, Territory, Year, and Month, and used maps, pie charts, bar charts, and line charts to present insights clearly and support data-driven decision-making.