ٍSupply chain Analysis
تفاصيل العمل
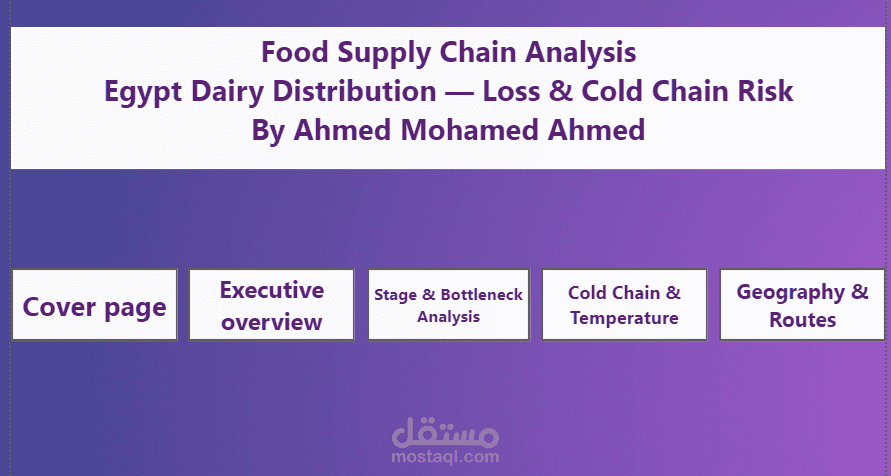
# The Cold Truth: What 850 Dairy Shipments Revealed About Egypt's Supply Chain
## The Question That Started It
A food distribution network moving dairy products across six governorates in Upper Egypt was losing product somewhere between farm and retail shelf. The question wasn't *whether* loss was happening — everyone already knew that. The question was **why**, and more importantly, **where to intervene first**.
With 850 shipment records covering everything from dispatch times to arrival temperatures, this was a chance to move past guesswork and let the data name the actual culprit.
## The Obvious Suspects — and Why They Were Wrong
Every supply chain investigation starts with the usual suspects. This one was no different.
**Suspect #1: Delay.** Surely shipments that sit in transit longer spoil more? The correlation between delay hours and loss percentage was just **0.246** — present, but weak. Delay matters, but it's not driving the bus.
**Suspect #2: Driver inexperience.** Maybe rookie drivers were mishandling temperature-sensitive cargo? The correlation here was **0.004** — statistically nothing. A driver with one year of experience lost the same percentage of product as one with ten.
**Suspect #3: Summer heat.** In a country where summer temperatures regularly exceed 40°C, this felt like the smoking gun. But cold-chain break rates were nearly identical in summer (46.15%) and the rest of the year (47.37%). Heat was a constant threat, not a seasonal spike.
Three plausible theories, three dead ends. This is the part of any analysis that doesn't make it into the final slide deck but matters just as much as the answer — ruling out what *isn't* true narrows the search.
## The Real Culprit
The answer had been sitting in the `Transport_Mode` column the entire time.
| Transport Mode | Avg. Loss % |
|---|---|
| Regular Truck | 16.84% |
| Motorbike (local) | 14.97% |
| Refrigerated Truck | 3.25% |
| Small Refrigerated Van | 2.84% |
Non-refrigerated transport was losing **five to six times more product** than refrigerated transport — and it wasn't a fringe case. **41% of all shipments** were moving on vehicles with no active cooling at all.
The same pattern showed up at the shipment level: when a cold-chain break occurred, average loss jumped from **1.58% to 16.43%** — a tenfold increase. Nearly half of all shipments (46.9%) experienced a break at some point in transit.
And the loss reasons confirmed it directly: **43% of all shipments cited "Spoilage – Temperature Abuse"** as the cause. Not damage in handling. Not delay past shelf life. Heat.
## Where in the Chain It Breaks
Mapping loss against each stage of the journey — farm to collection center, collection center to factory, factory to distribution center, distribution center to retail — showed the damage wasn't evenly spread. The **Distribution Center to Retail** leg carried the highest average loss (9.66%), the final and most fragmented stretch of the journey, often the one relying most heavily on smaller, non-refrigerated vehicles for last-mile delivery.
Geographically, **Sohag** stood out as the highest-loss origin governorate — worth flagging for anyone deciding where to pilot a fix first.
## The Business Case, in One Line
If refrigerated transport keeps loss around 3% and non-refrigerated transport runs at 15–17%, then every shipment moved off a regular truck and onto a refrigerated van is a direct, measurable reduction in spoiled product — no process redesign required, no new technology to develop. It's a resource-allocation decision, not an innovation problem.
## What This Project Actually Demonstrates
Beyond the dairy industry specifics, this analysis is really about a discipline: **resist the first plausible explanation, and let correlation strength — not intuition — decide what gets investigated further.** Delay felt like the obvious cause. Driver experience felt like a reasonable secondary factor. Both were tested, both were weak, and neither made it into the recommendation. The variable that actually mattered was the one that required checking, not assuming.
That's the difference between a dashboard that reports numbers and one that changes a decision.
---
*Built from a 850-shipment dataset covering product type, transport mode, supply chain stage, temperature readings, and delay across six Upper Egypt governorates. Full analysis includes a star-schema data model, Power BI dashboard with drill-through detail, and outlier detection via IQR/boxplot methods.*