Sales Dashboard project
تفاصيل العمل
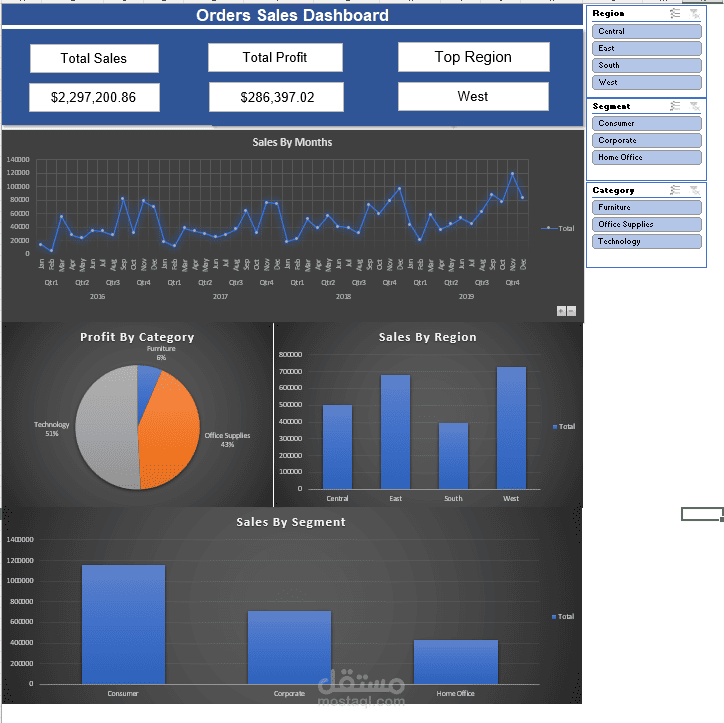
Project Steps:
• Data Cleaning & Preparation
• Building Pivot Tables
• Creating KPI Cards
• Sales & Profit Analysis
• Regional Performance Analysis
• Category & Segment Analysis
• Interactive Dashboard Design using Slicers
Key Insights:
• The West region recorded the highest sales performance.
• Discounts had a noticeable impact on profitability.
• Technology products generated the highest share of profit.
• Customer segments showed different purchasing behaviors and sales trends.
Tools Used:
• Microsoft Excel
• Pivot Tables
• Pivot Charts
• Slicers
• Dashboard Design