T-Shirt Sales Dashboard
تفاصيل العمل
T-Shirt Sales Dashboard
Project Overview
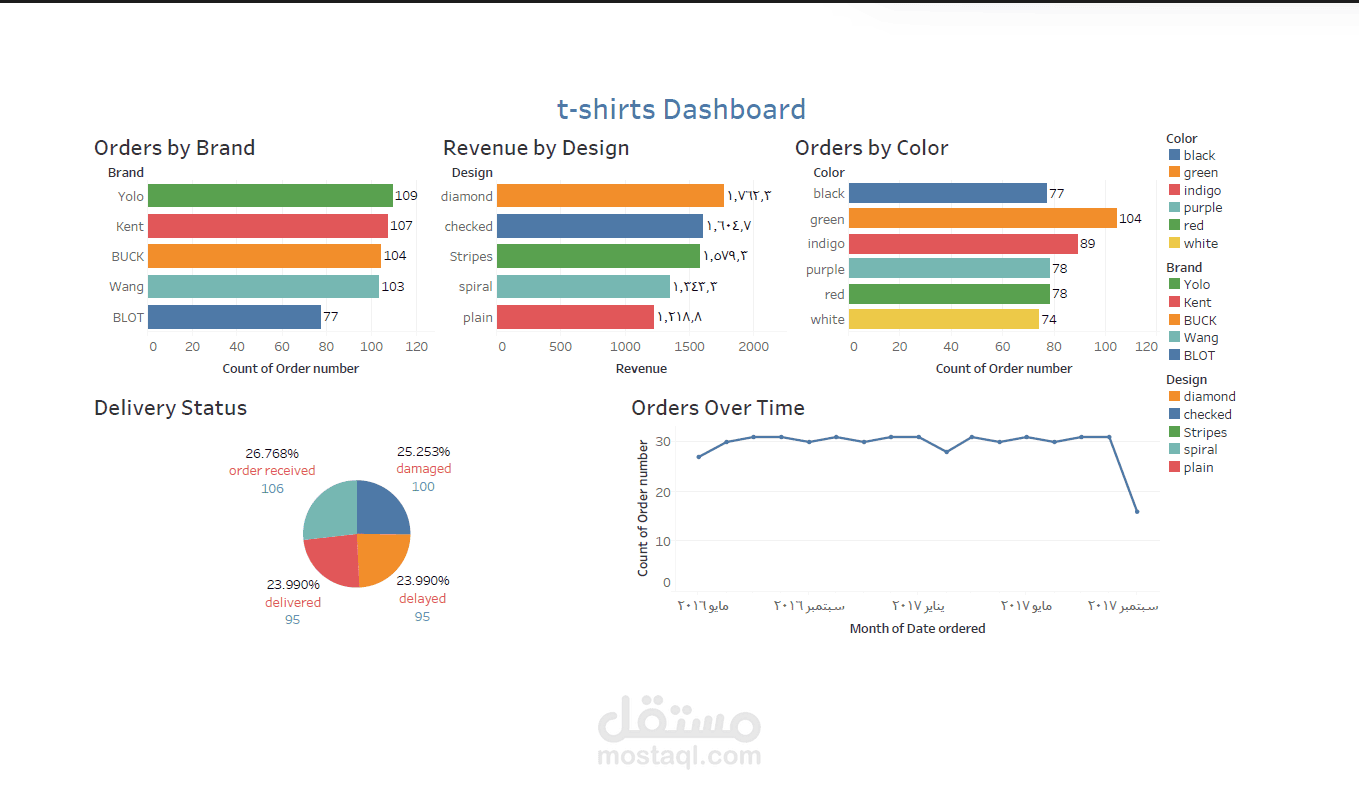
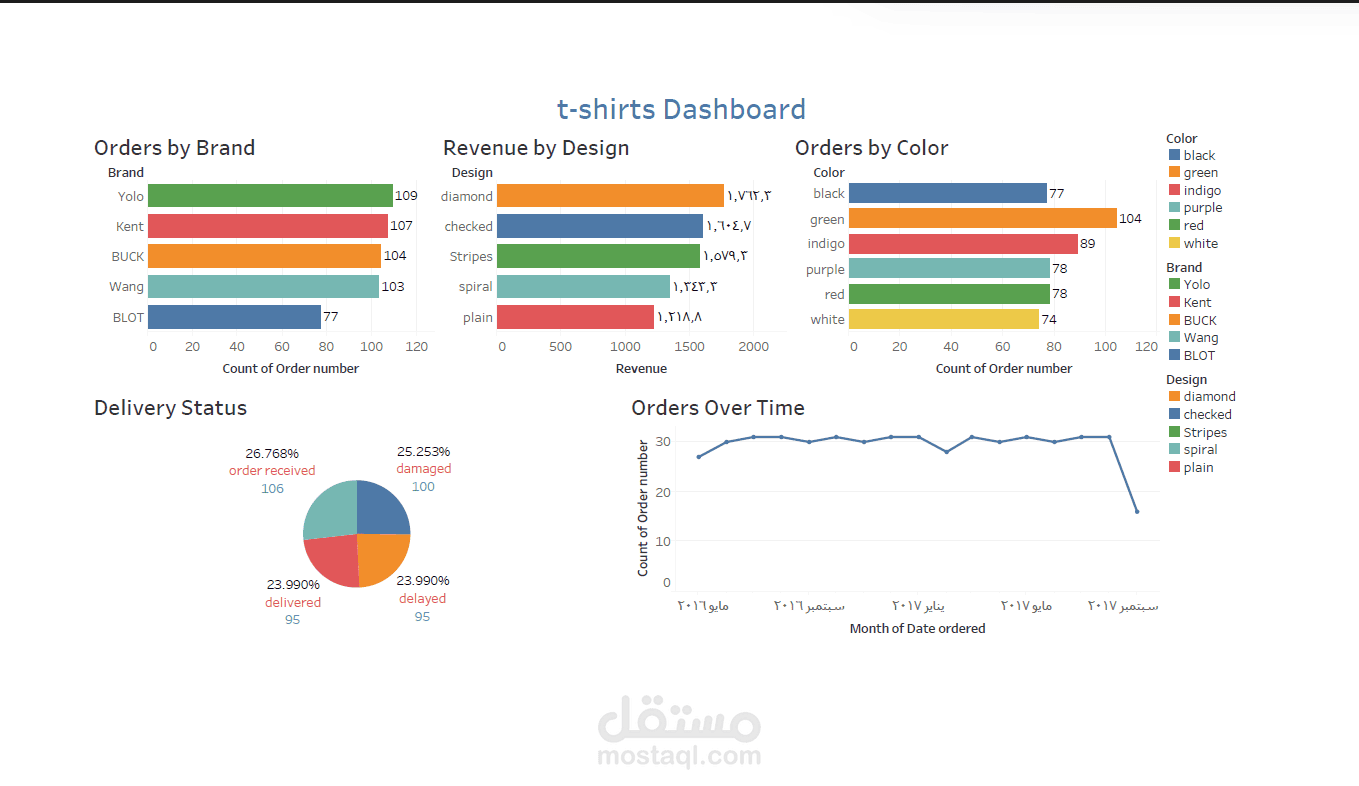
Created an interactive Tableau dashboard to analyze T-shirt sales and order performance across different brands, designs, colors, and delivery statuses.
The dashboard provides a clear view of order distribution and revenue through interactive visualizations, including Orders by Brand, Revenue by Design, Orders by Color, Delivery Status, and Orders Over Time.
The dashboard was designed with a clean and organized layout, suitable formatting, and clear visualizations to make sales data easier to understand and support data-driven insights.
Tools & Technologies
Tableau | Data Visualization | Dashboard Design
Dashboard Features
Orders by Brand — compares the number of orders across different brands.
Revenue by Design — analyzes total revenue generated by each T-shirt design.
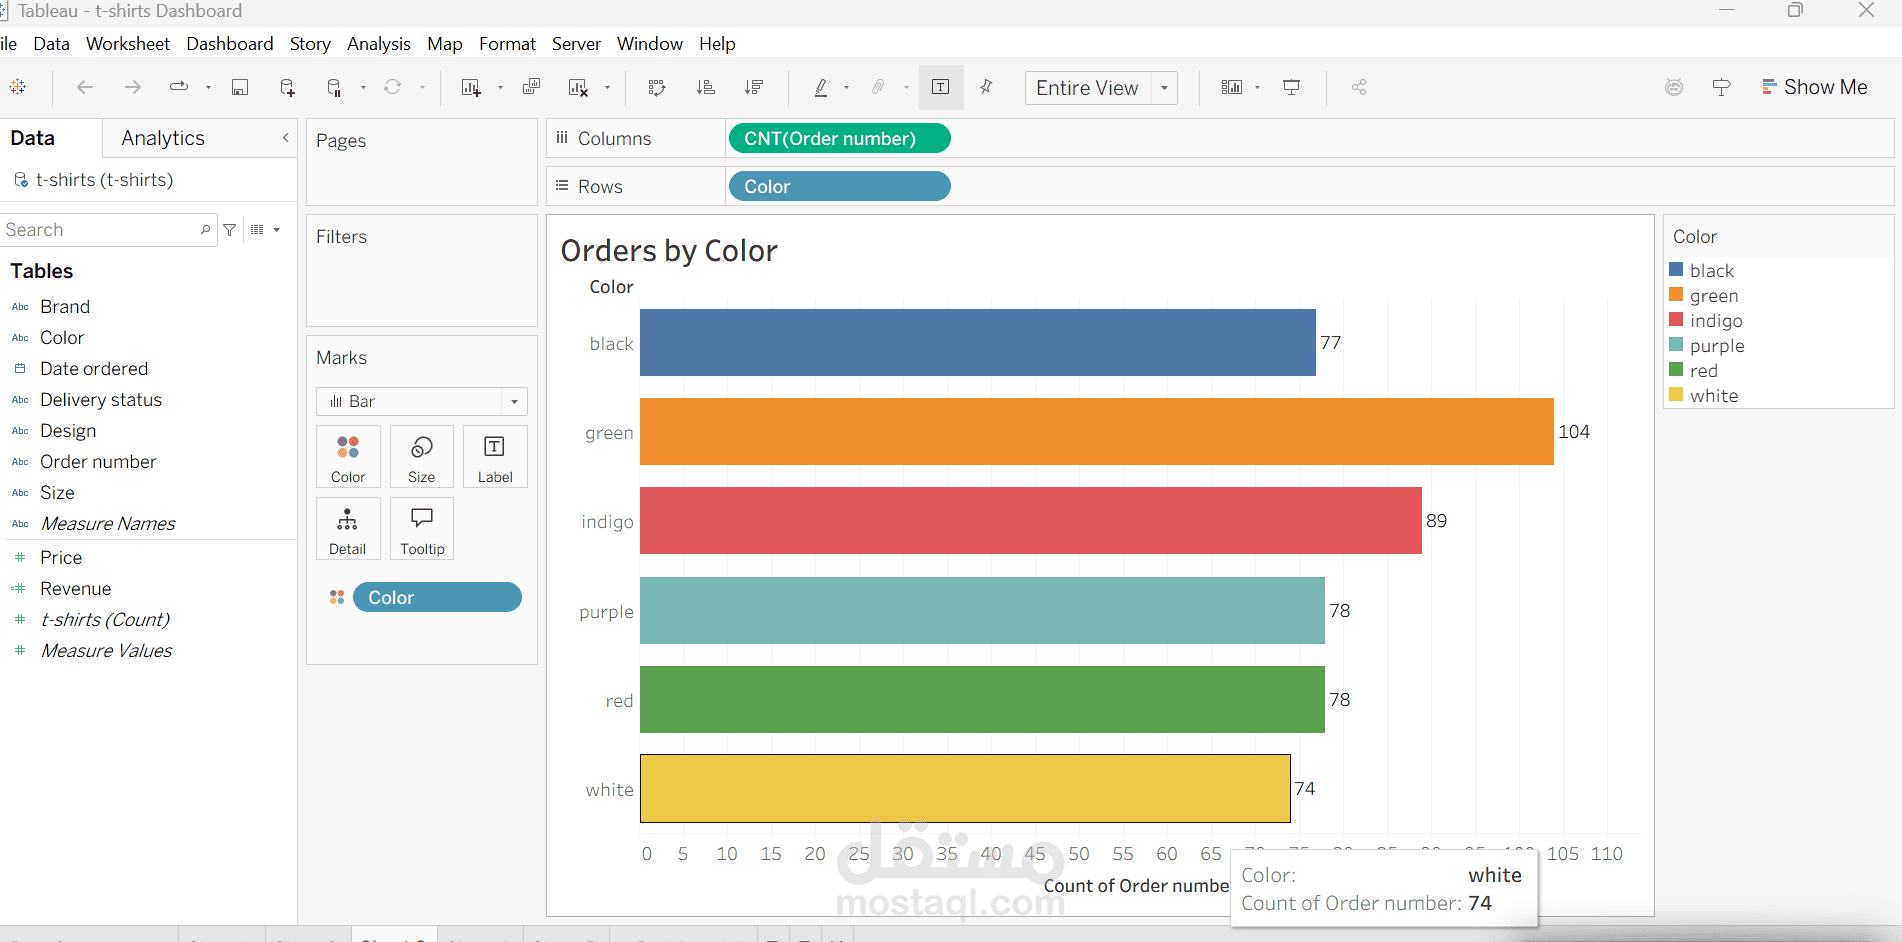
Orders by Color — shows the distribution of orders across colors.
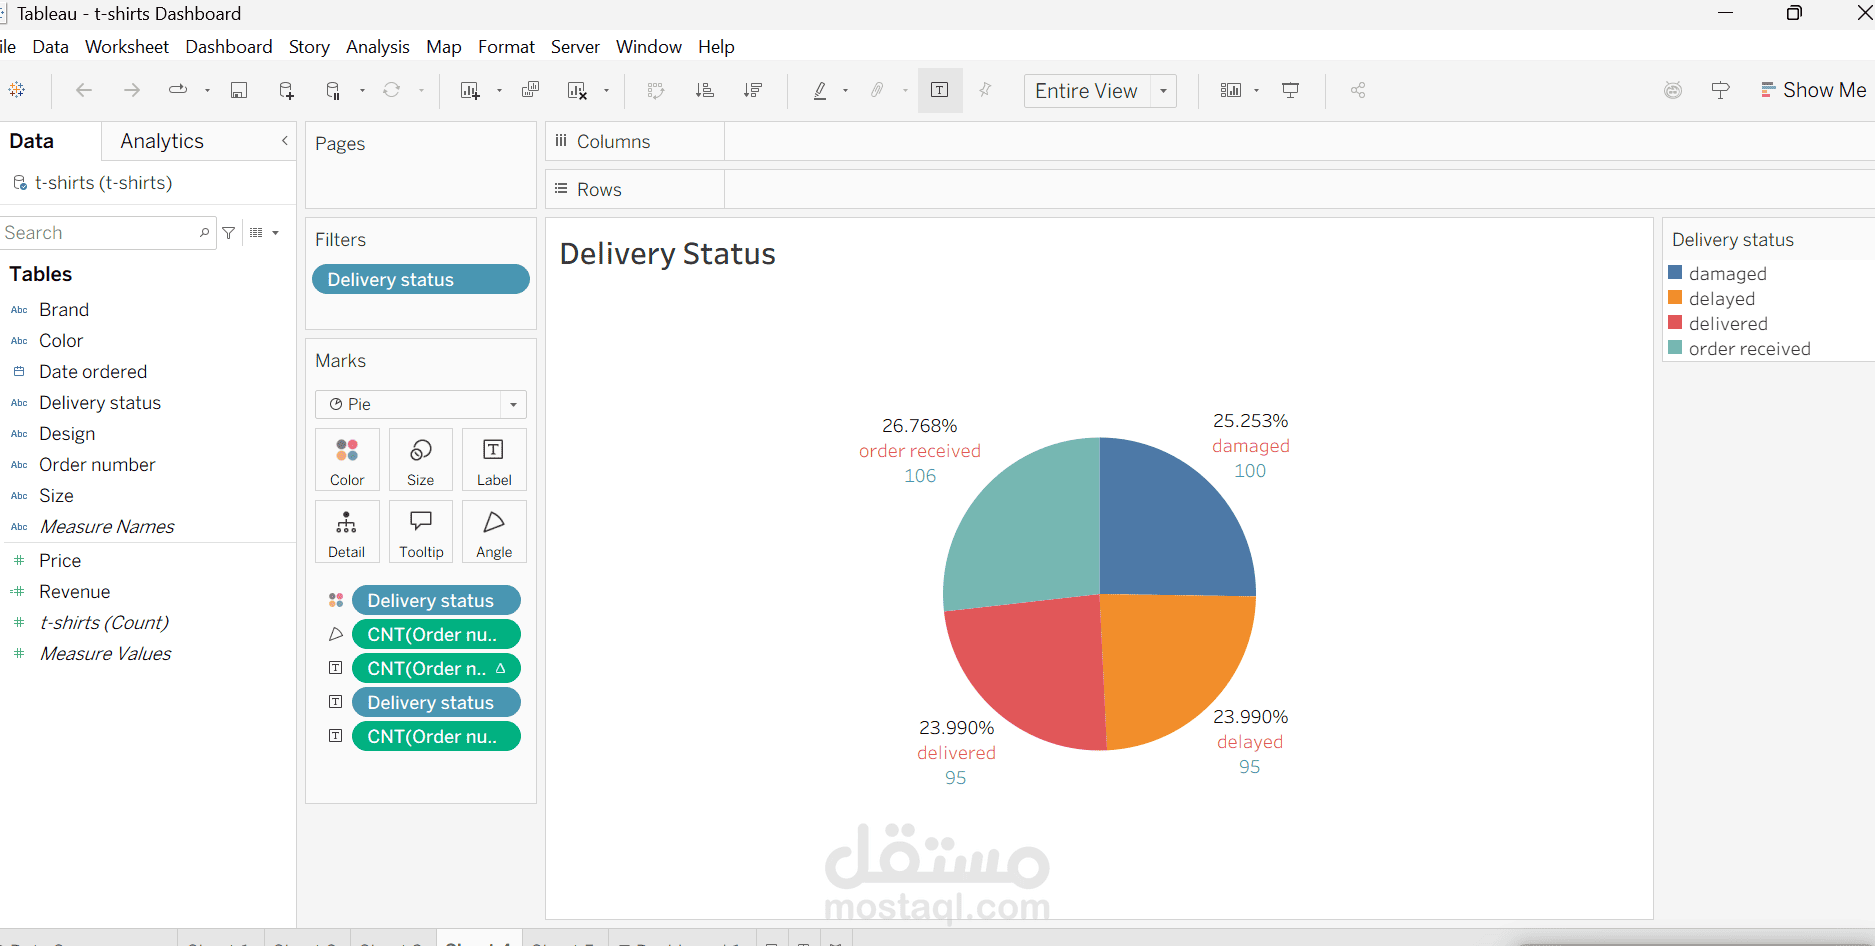
Delivery Status — visualizes the distribution of orders by delivery status.
Orders Over Time — tracks order trends over time.
Project Focus
Data Visualization | Interactive Dashboards | Sales Analysis | KPI Analysis | Business Insights