Superstore Data Analysis
تفاصيل العمل
Superstore Sales & Profitability Analysis
Project Overview
Analyzed the Sample Superstore 2019 dataset using Python to uncover insights into sales performance, profitability, customer behavior, and operational efficiency.
The project included data cleaning and preprocessing, feature engineering, exploratory data analysis (EDA), statistical and correlation analysis, KPI evaluation, and data visualization.
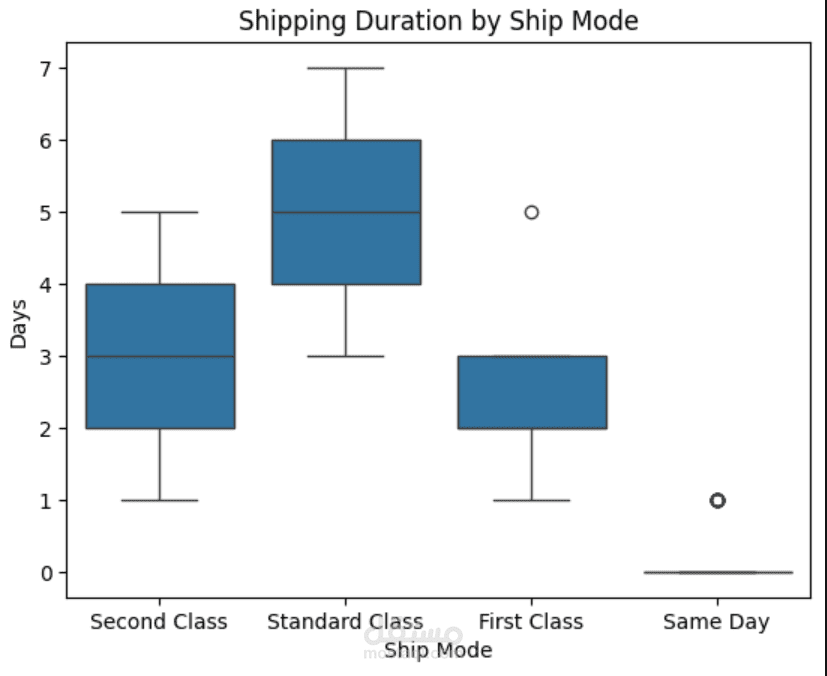
Analytical features such as Profit Margin, Shipping Duration, and Sales Performance Category were created to provide deeper insights into business performance and trends.
Tools & Technologies
Python | Pandas | NumPy | Matplotlib | Seaborn | Jupyter Notebook
Key Insights
Identified the Technology category as having the highest average profit.
Found the West region to be the top-performing region in terms of sales.
Analyzed relationships between sales, profit, quantity, and other numerical variables.
Evaluated shipping performance and its relationship with business performance.
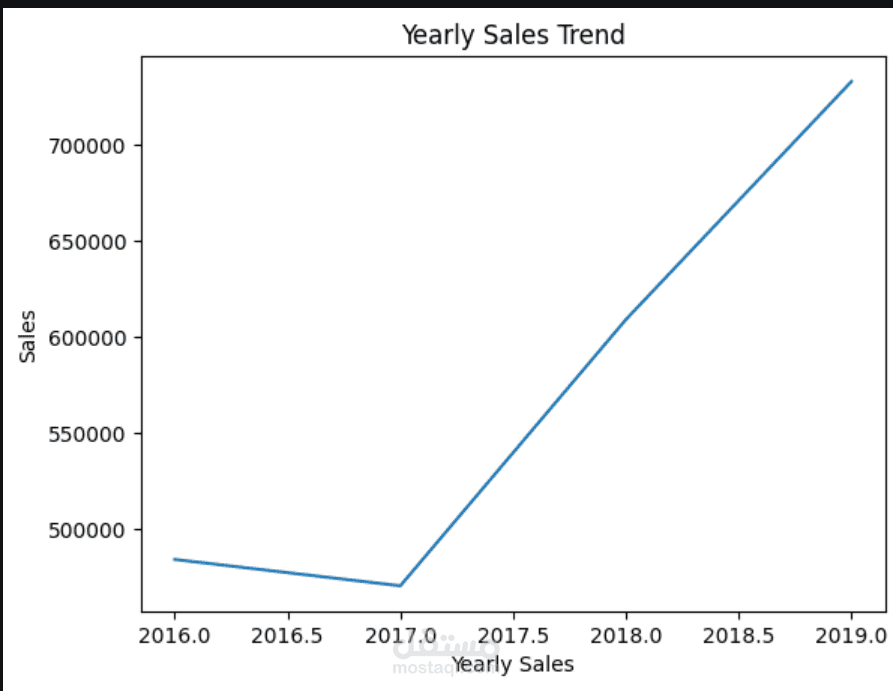
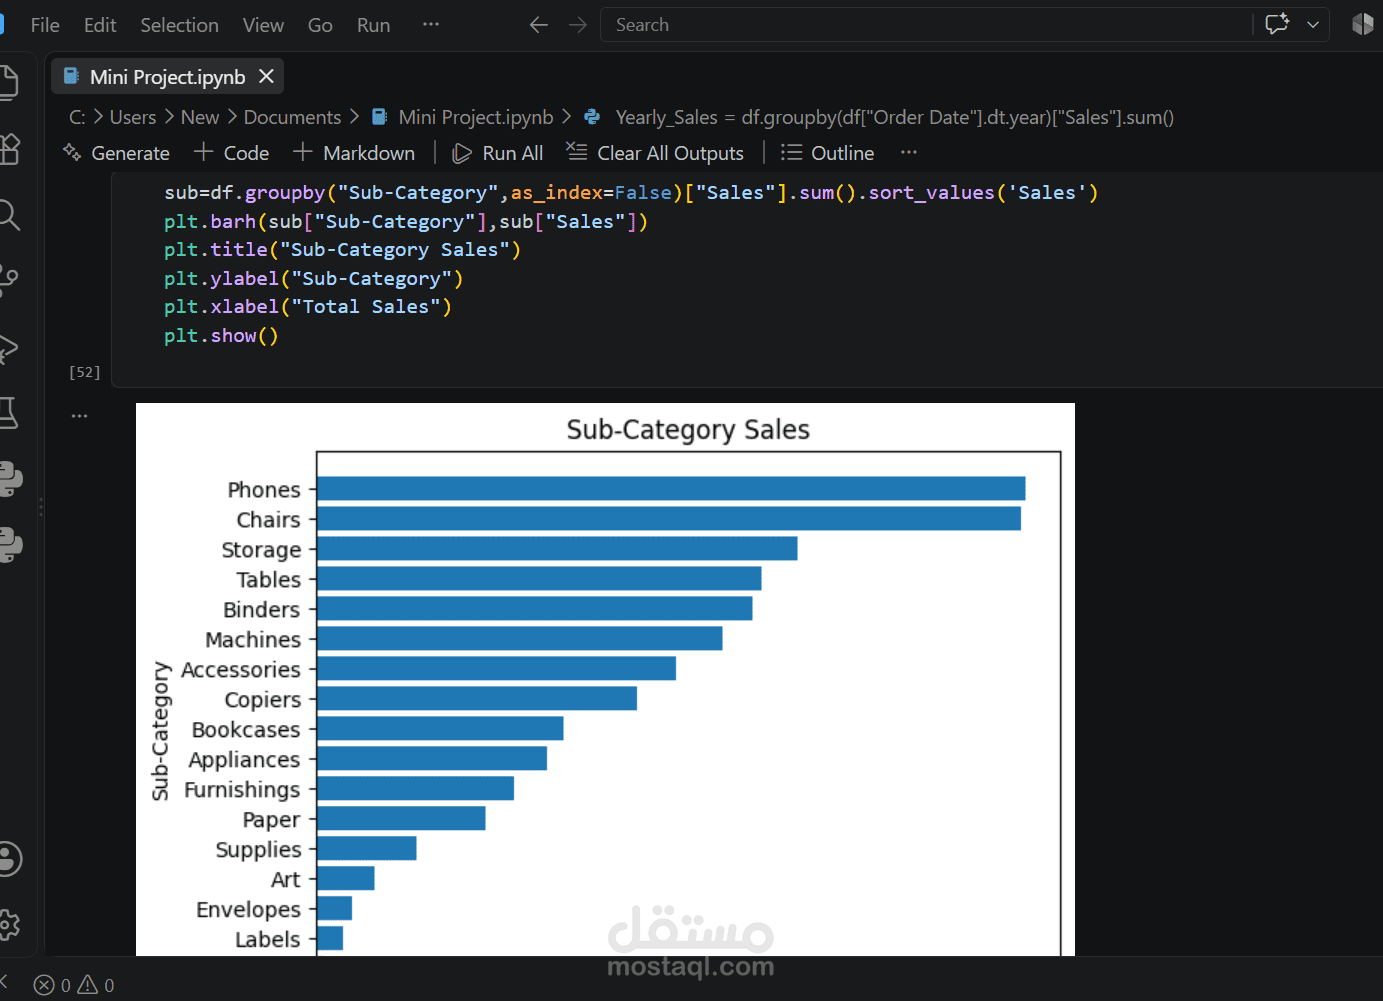
Used KPIs and visualizations to highlight important sales and profitability trends.
Project Focus
Data Cleaning | Exploratory Data Analysis | Feature Engineering | Statistical Analysis | KPI Analysis | Data Visualization