BreastCancer Dahboard
تفاصيل العمل
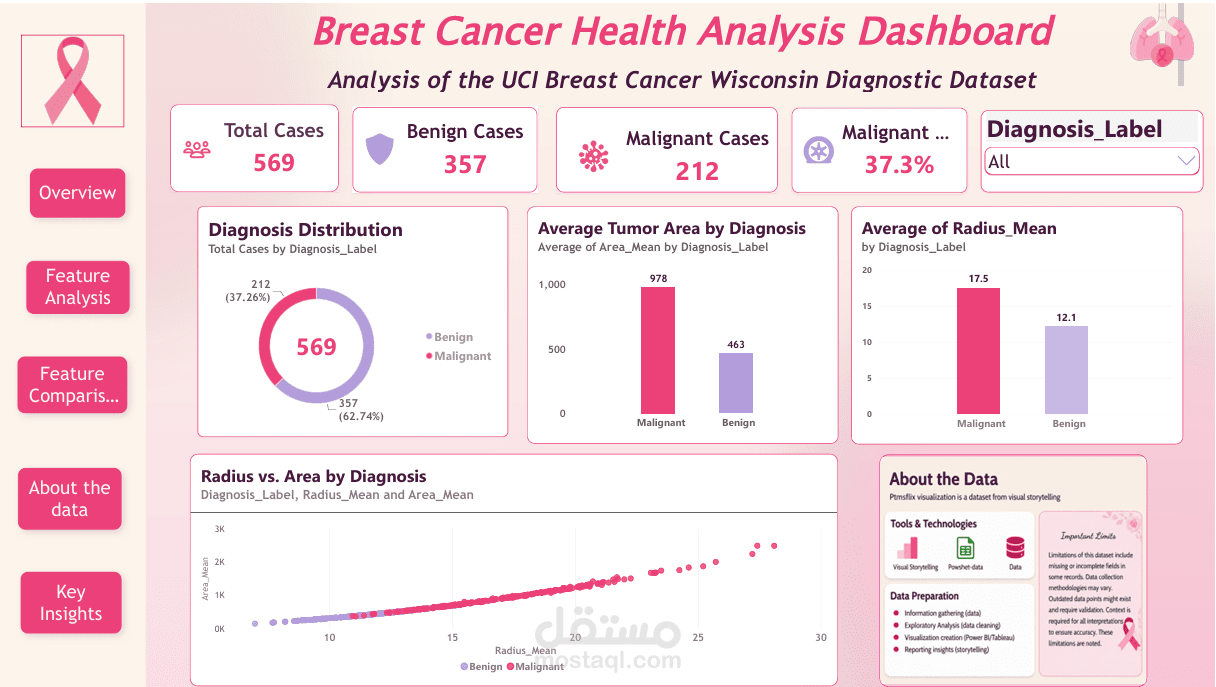
🎀 Breast Cancer Health Analysis Dashboard
💗 Interactive Healthcare Data Analytics with Power BI
Power BI • Power Query • DAX • Data Visualization • Exploratory Data Analysis
1. 📌 Project Overview
Breast Cancer Health Analysis Dashboard is an interactive Power BI data analytics and visualization project developed to explore and analyze the UCI Breast Cancer Wisconsin (Diagnostic) Dataset.
The project focuses on analyzing breast tumor diagnostic measurements and comparing Benign and Malignant cases through interactive dashboards and visualizations.
Using Power Query for data preparation and DAX for analytical measures and KPIs, the dashboard transforms raw healthcare data into an interactive and easy-to-understand analytical report.
⚠️ Disclaimer: This project is intended for educational, analytical, and data visualization purposes only. It is not a medical diagnostic system and must not be used to make medical decisions.