Advanced Enterprise Sales & Business Intelligence Analytics Dashboard
تفاصيل العمل
Interactive Business Intelligence & Sales Analytics Dashboard
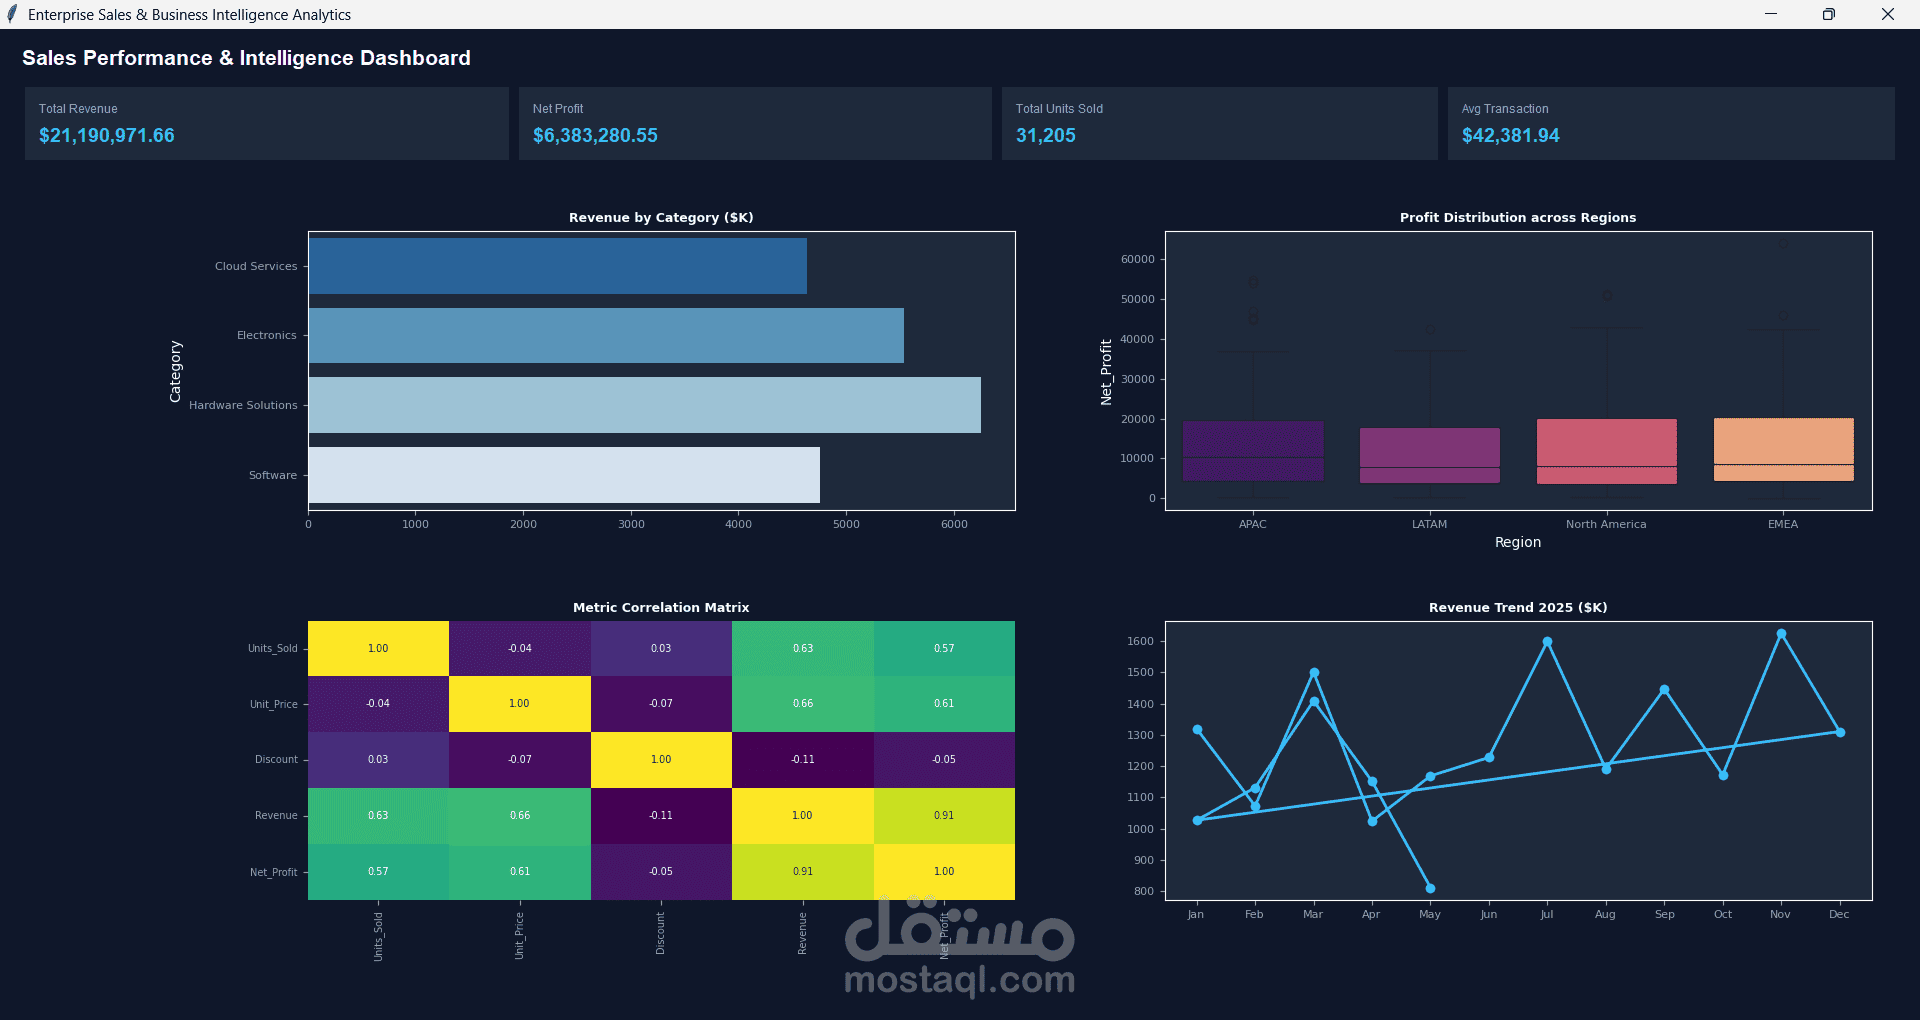
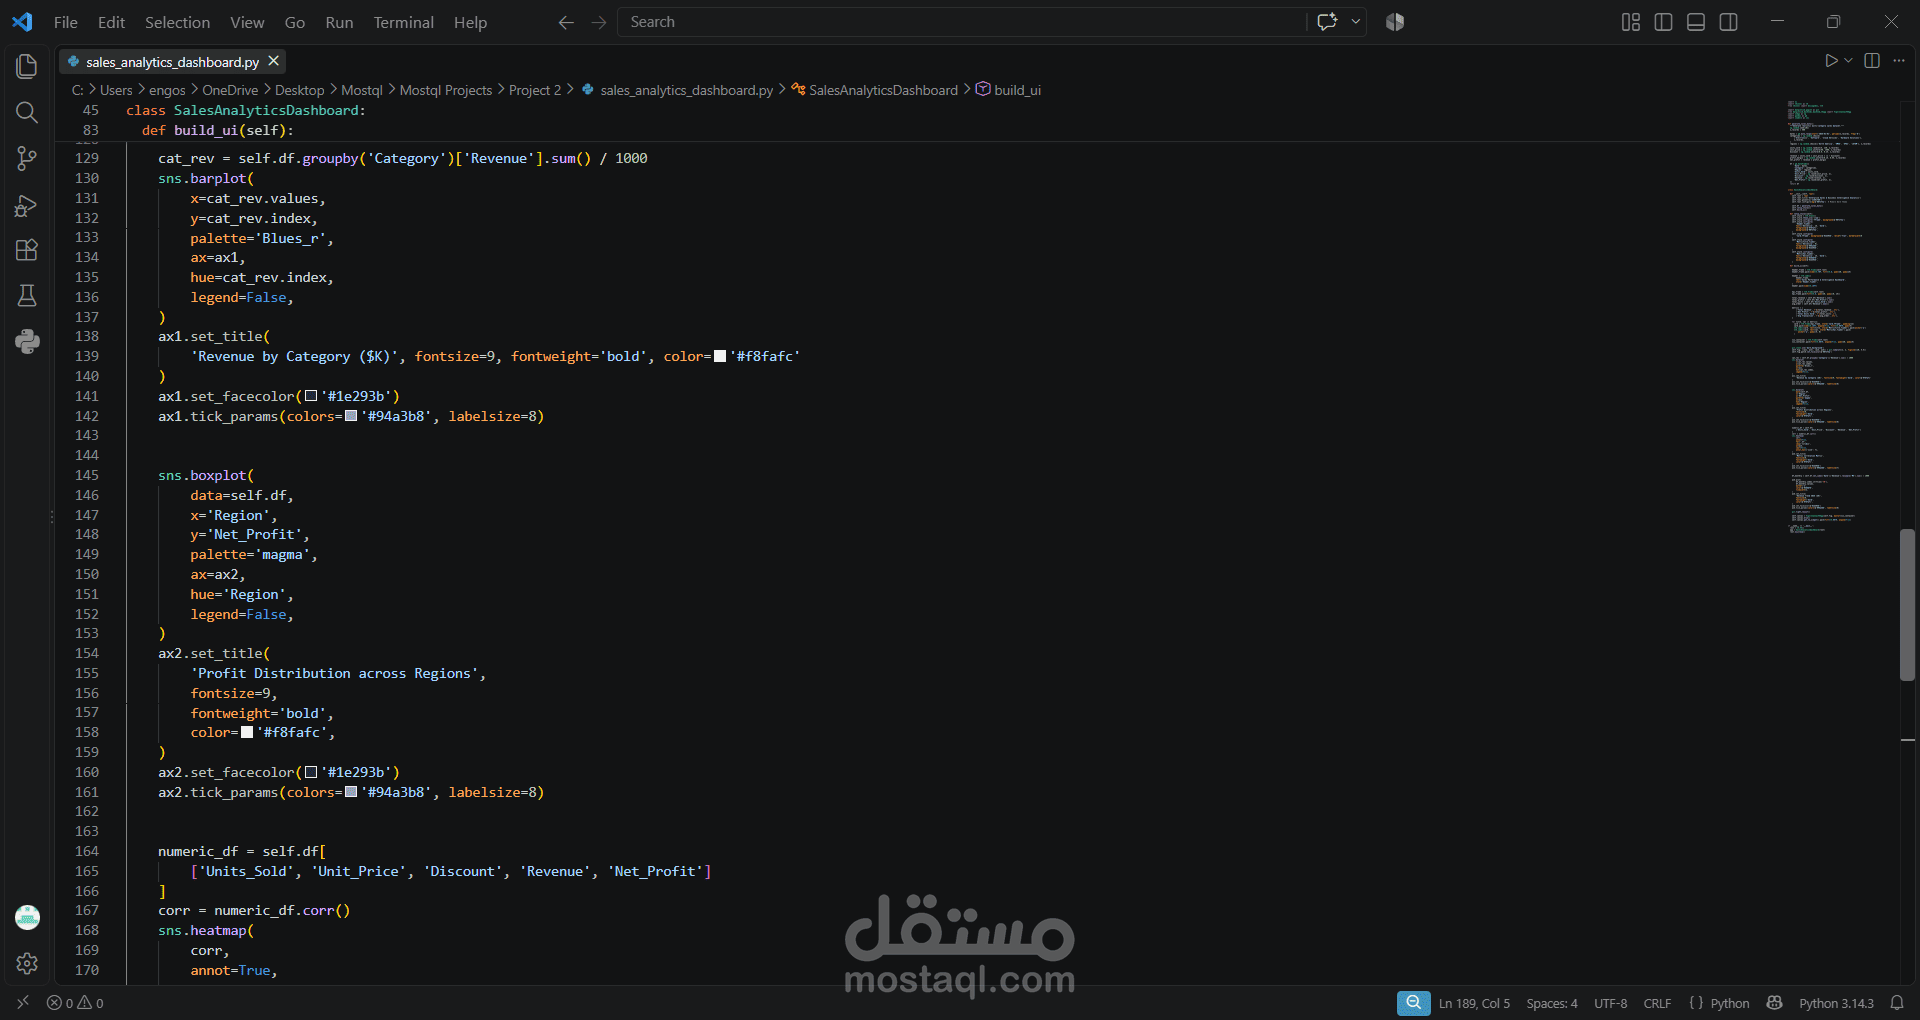
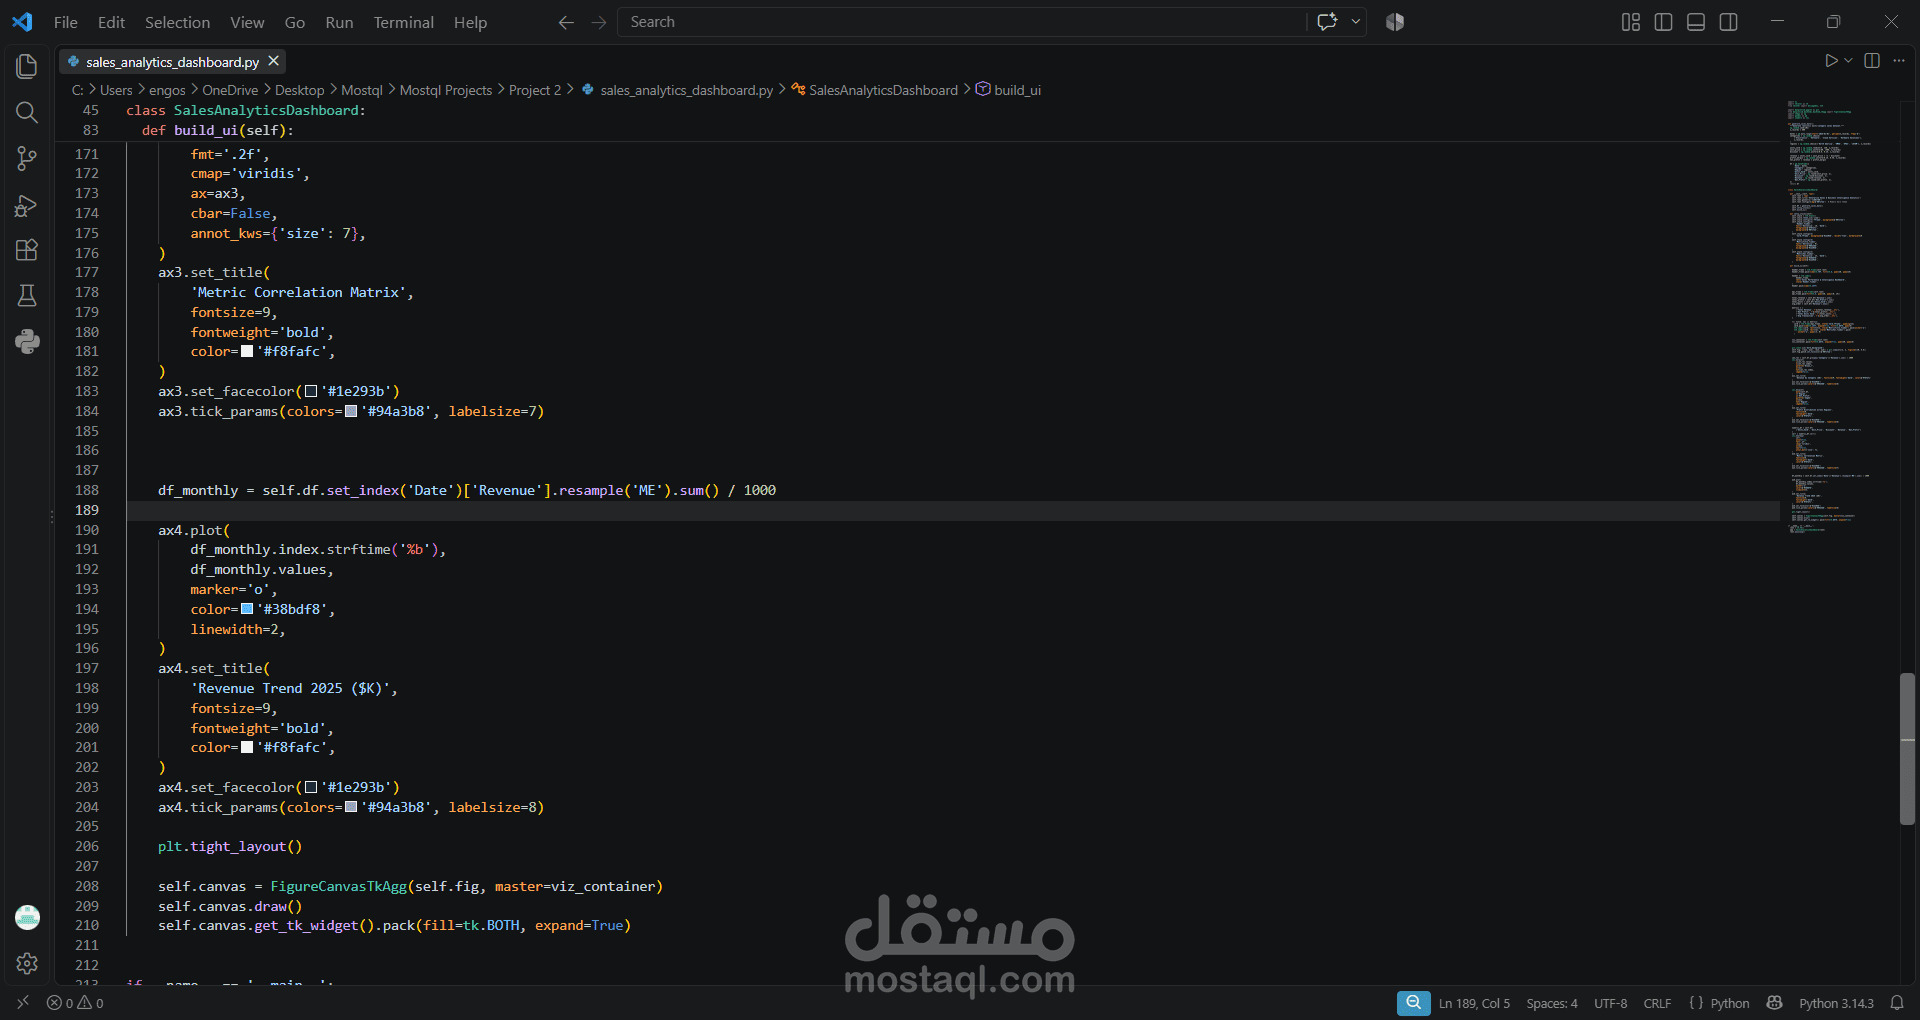
A comprehensive Python desktop analytics tool designed to process enterprise sales datasets and synthesize key performance metrics (KPIs) through real-time visualizations.
Key Features:
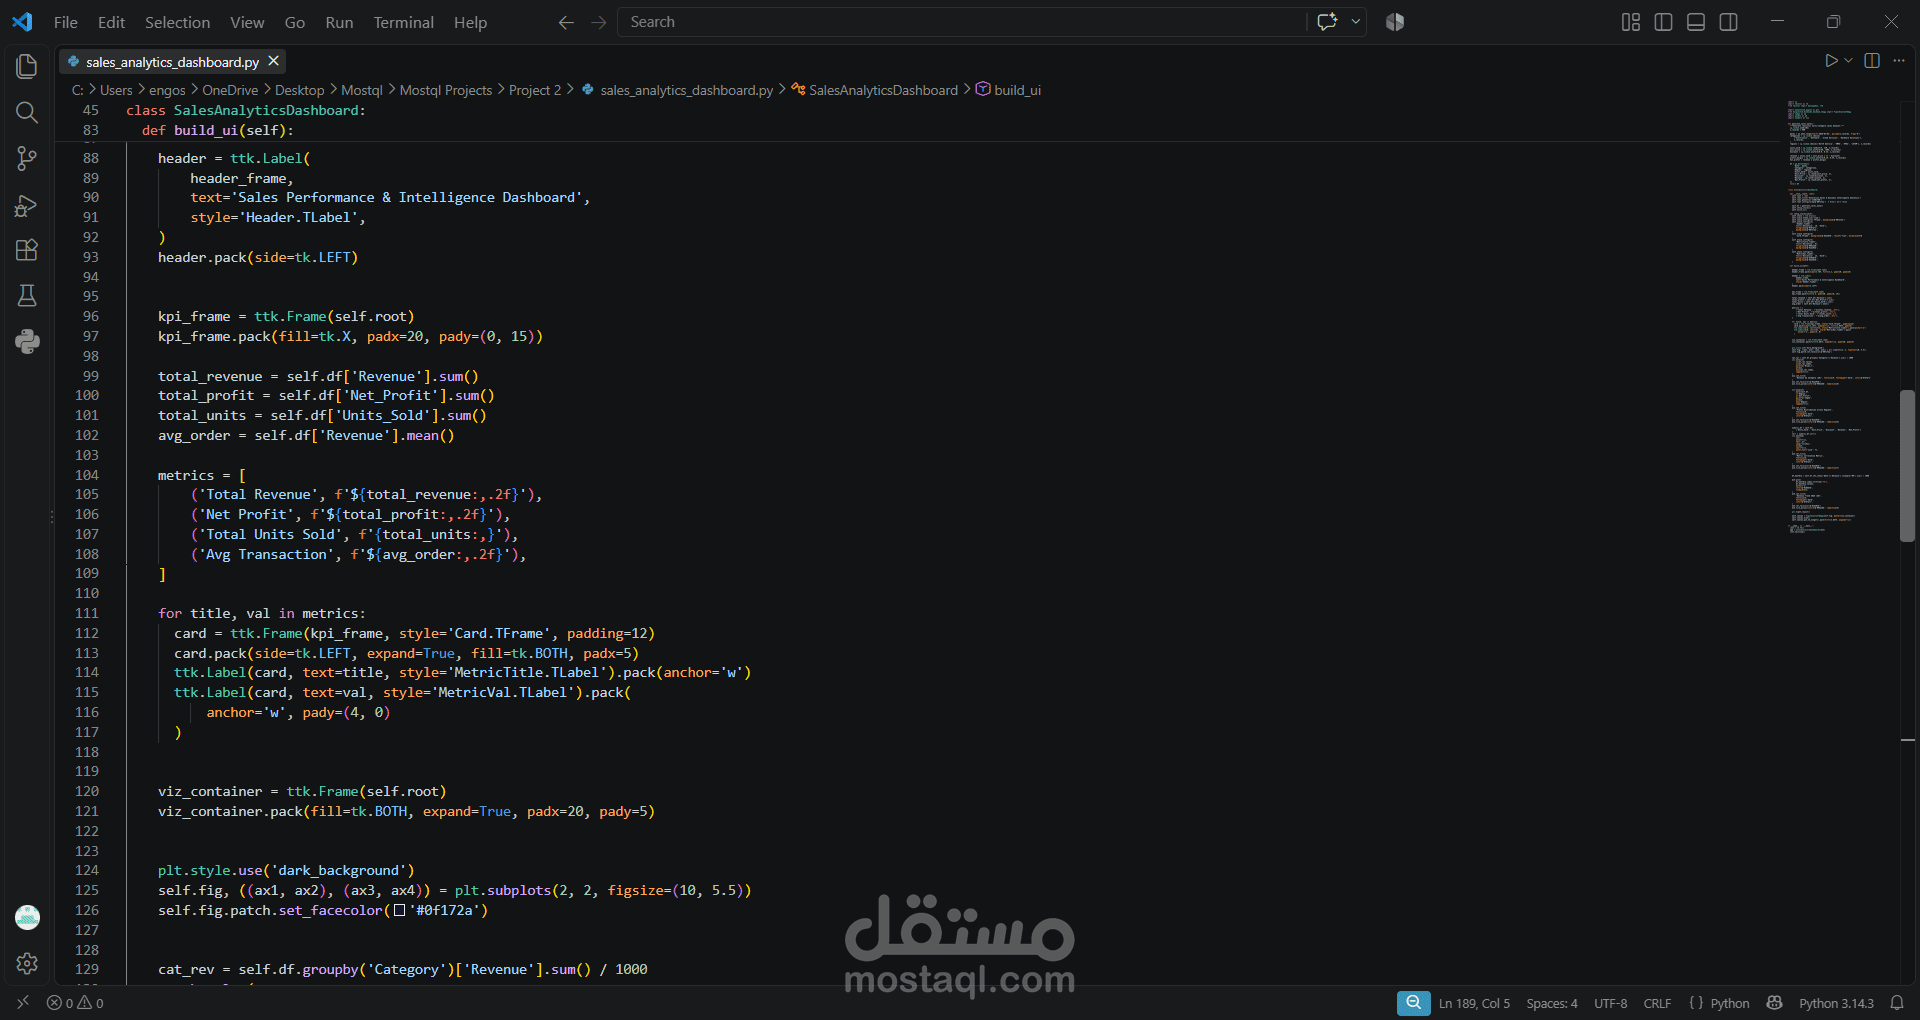
Executive KPI Indicators: Automated calculation of total revenue, net margins, total units sold, and average order values.
Multi-Dimensional Analytics: Visual breakdown of revenue by product categories and profit distribution across global regions using Seaborn and Matplotlib.
Statistical Correlation & Trend Analysis: Feature correlation matrices alongside monthly revenue forecasting trends for business strategic planning.
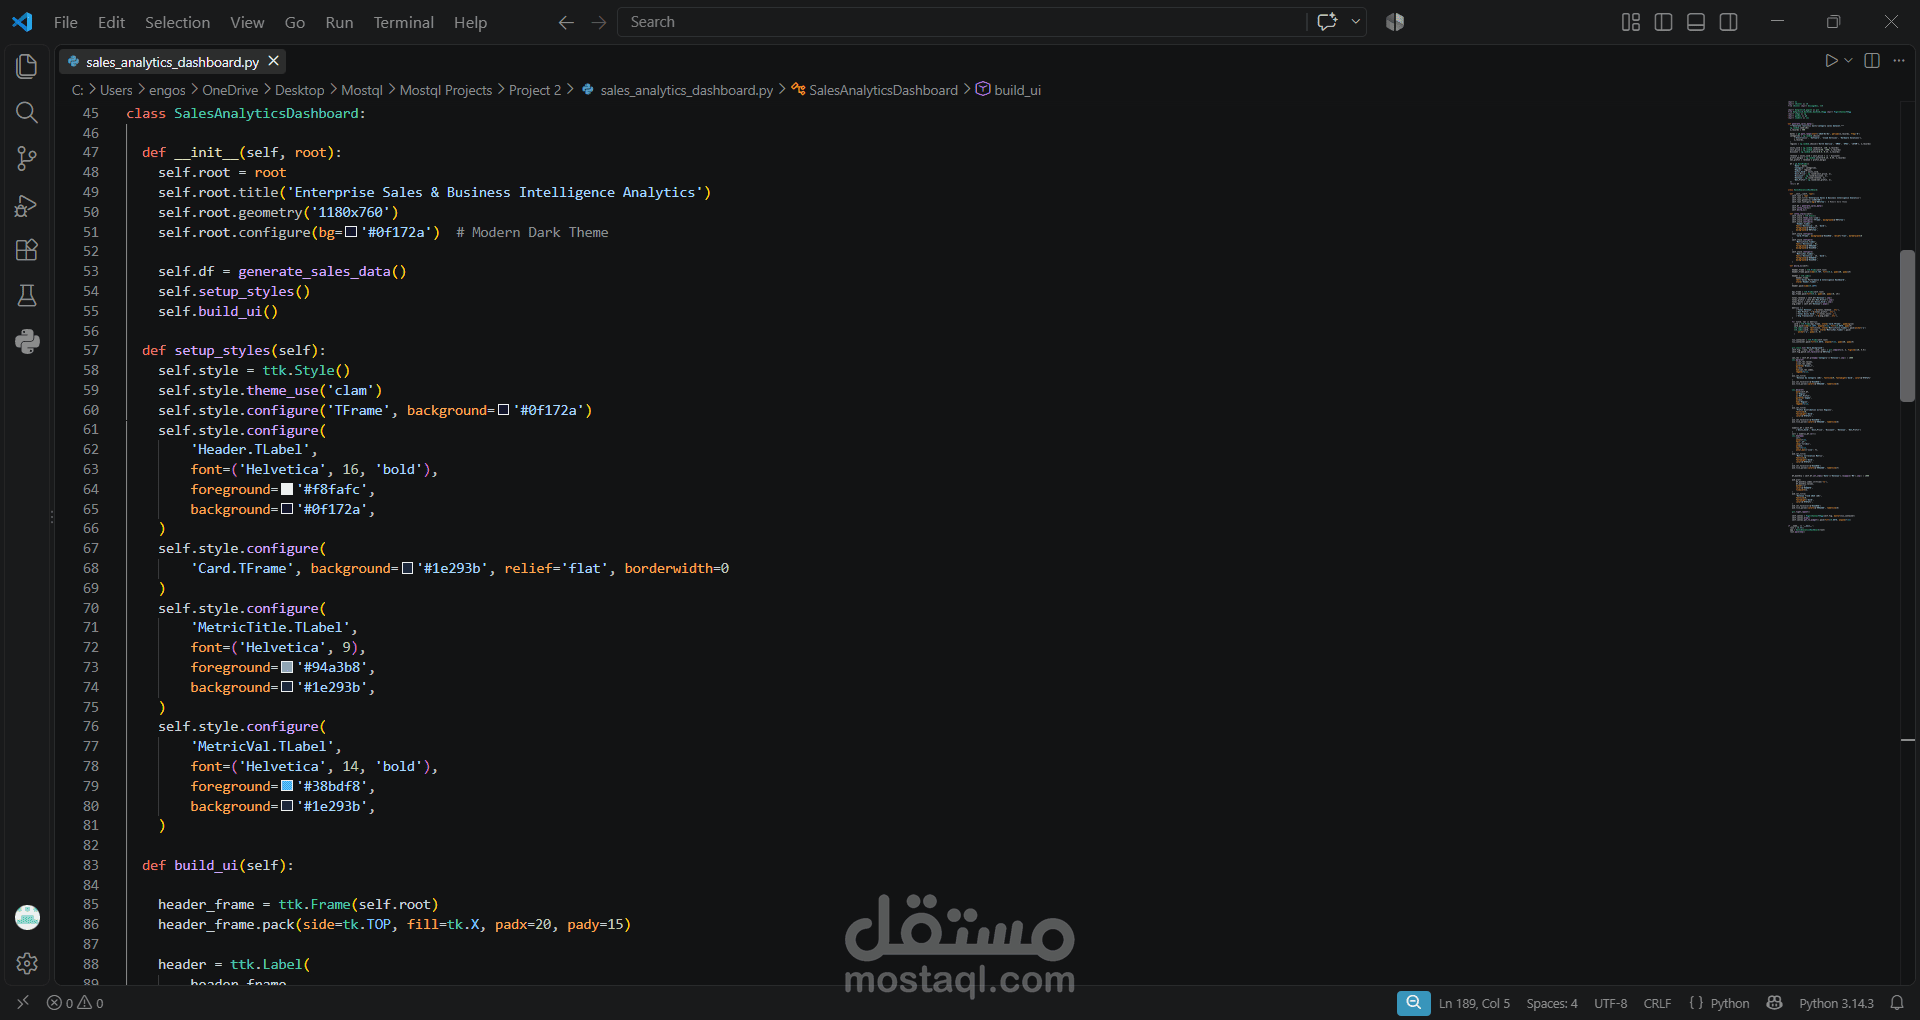
Modern UI/UX: Styled with a dark-themed Tkinter interface integrated with embedded Matplotlib canvases.
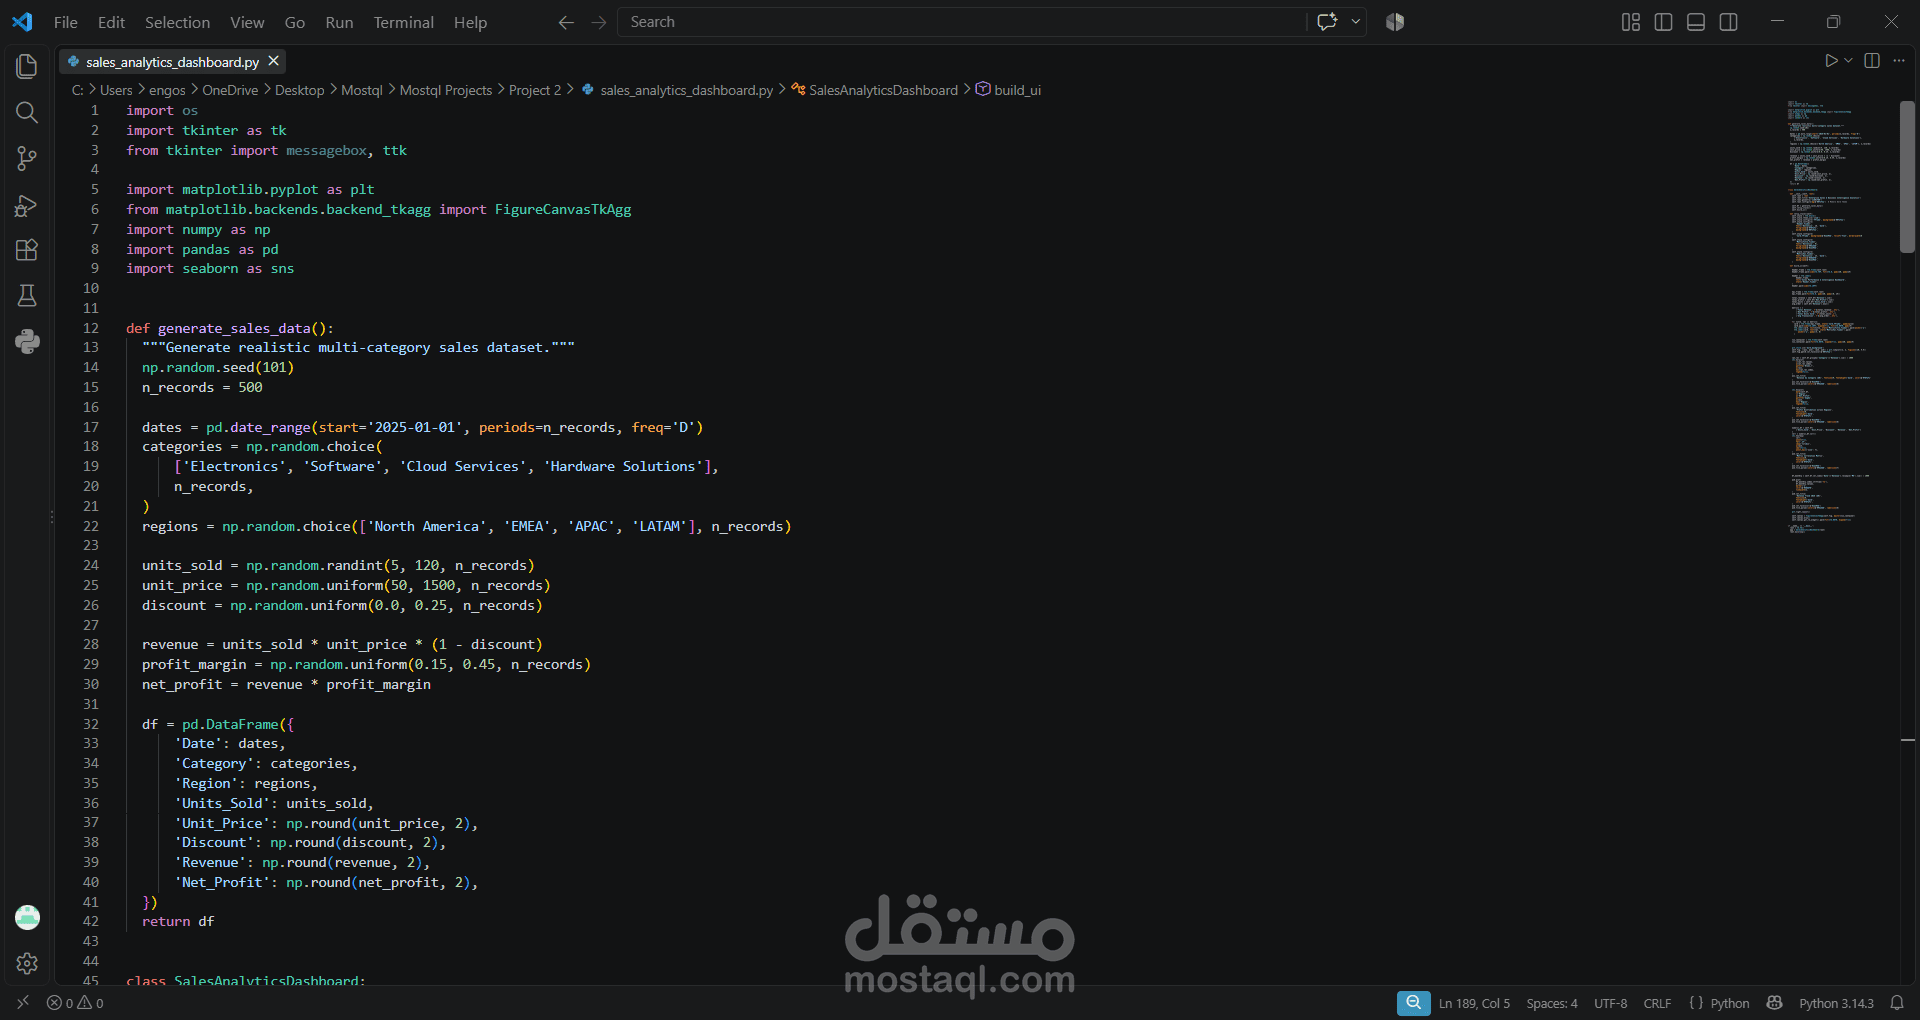
Tech Stack: Python, Tkinter, Pandas, NumPy, Matplotlib, Seaborn.