interactive Power BI dashboard
تفاصيل العمل
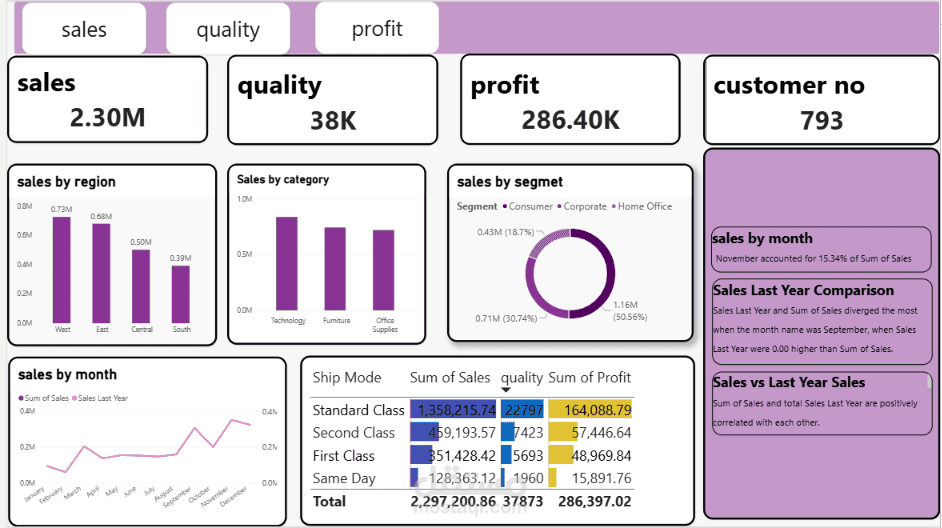
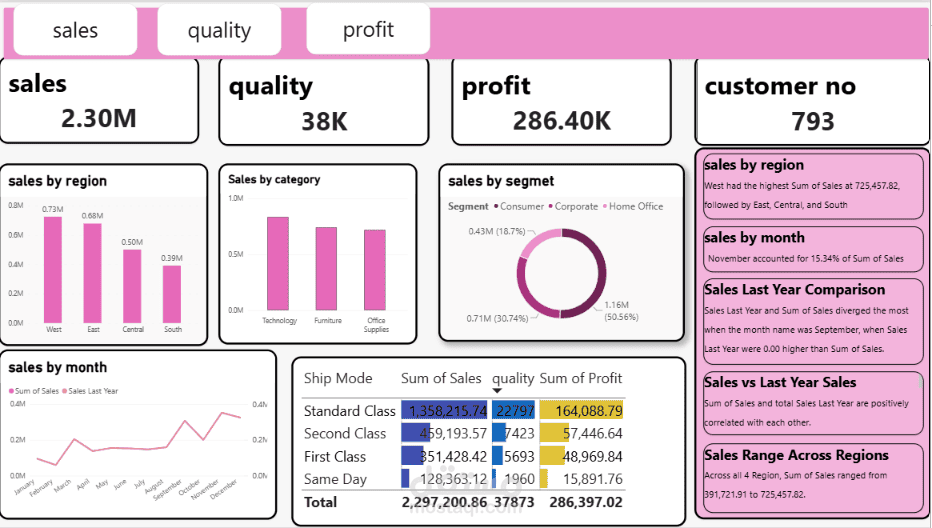
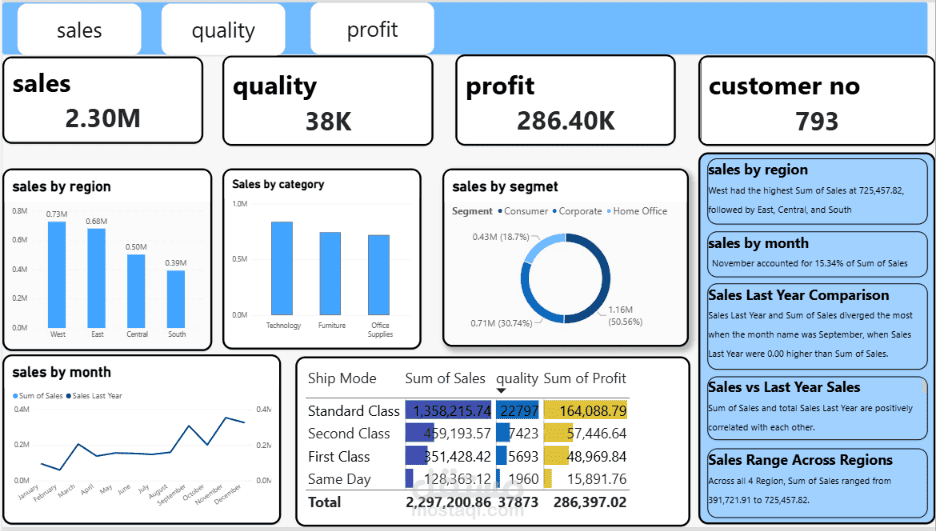
his interactive Power BI dashboard provides a comprehensive analytical system divided into three main sections—Sales, Quality, and Profit—seamlessly navigated using bookmarks and customized color themes. The dashboard displays an executive overview featuring total sales of 2.30M, 38K units, 286.40K in profits, and 793 customers. It is supported by detailed charts showing geographic sales distribution across regions (led by the West), categories, and segments, alongside a ship-mode performance table and precise year-over-year comparisons. Additionally, built-in smart narratives on the sidebar offer automated insights to empower stakeholders in tracking key performance indicators effectively.