digital products sales Analysis Dashboard
تفاصيل العمل
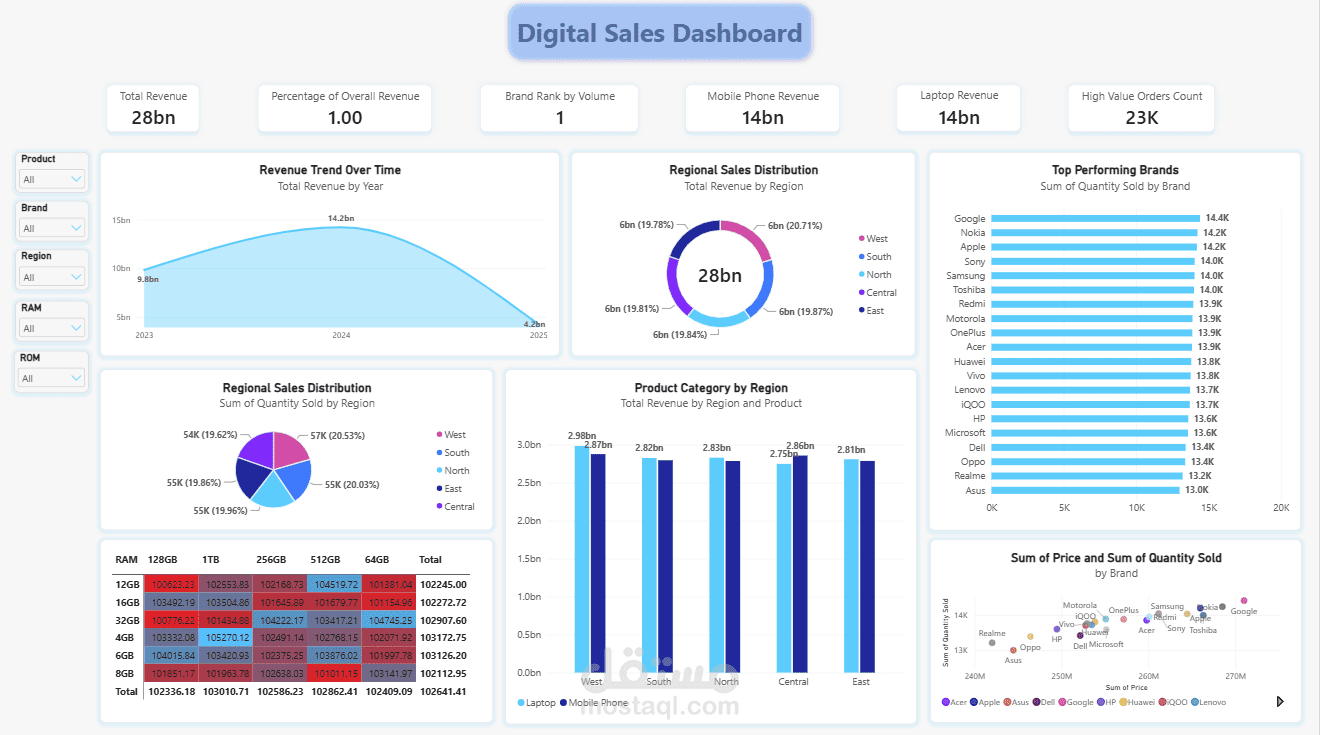
Unlocking Consumer Electronics Trends: Analyzing $28 Billion in Digital Sales!
I just rolled out my latest Business Intelligence project: The Digital Sales Dashboard. This time, I dove into the massive, high-velocity world of consumer electronics, building a centralized tool to track hardware sales, brand performance, and device configurations across a multi-billion dollar dataset.
Here is a look at the technical architecture and the story the data tells:
Data Architecture & Dimensional Modeling
Hardware Specifications Parsing: Engineered a robust data model to handle complex product attributes, specifically splitting out memory configurations (RAM and ROM) to allow for granular cross-filtering.
Advanced DAX & Aggregations: Built custom measures to track macroscopic KPIs, including an overarching Total Revenue of $28bn, exactly split between Mobile Phones ($14bn) and Laptops ($14bn), while identifying 23K High-Value Orders.
Time-Intelligence: Implemented time-series tracking to map revenue trajectories from 2023 through 2025, capturing peak historical velocity ($14.2bn in 2024).
Visual Analytics & UI/UX Design
Clean, Modern Interface: Pivoted to a crisp, light-themed aesthetic with a structured grid layout. This allows the high-density data to breathe and keeps the executive focus on the numbers.
Configuration Heatmap: Designed a custom matrix visual mapping RAM vs. ROM combinations (e.g., 16GB/1TB). Using conditional formatting (red-to-blue gradients), it instantly highlights which hardware specs are dominating the market.
Market Positioning Matrix: Deployed a scatter plot (Price vs. Quantity Sold by Brand) to visualize where different tech giants sit on the value spectrum.
Global Slicing: Added a comprehensive filter pane on the left (Product, Brand, Region, RAM, ROM) to empower users to slice the $28bn dataset down to highly specific hardware niches.
Key Market Insights Unlocked
Perfect Product Parity: The data reveals an incredible 50/50 revenue split between Laptops and Mobile Phones across all geographic regions.
Brand Wars: While the market is highly competitive, Google narrowly takes the #1 spot for unit volume (14.4K), closely followed by Nokia, Apple, and Sony.
Geographic Consistency: Revenue and volume distribution are exceptionally balanced across all five regions (West, South, North, Central, East), each holding a steady ~20% market share.
Translating raw technical specifications and transactional databases into strategic, accessible insights is what makes the Information Systems and analytics space so rewarding. On to the next challenge!