Health Insurance Charges Analysis Dashboard
تفاصيل العمل
Unlocking Healthcare Economics: Predicting & Analyzing Medical Insurance Costs!
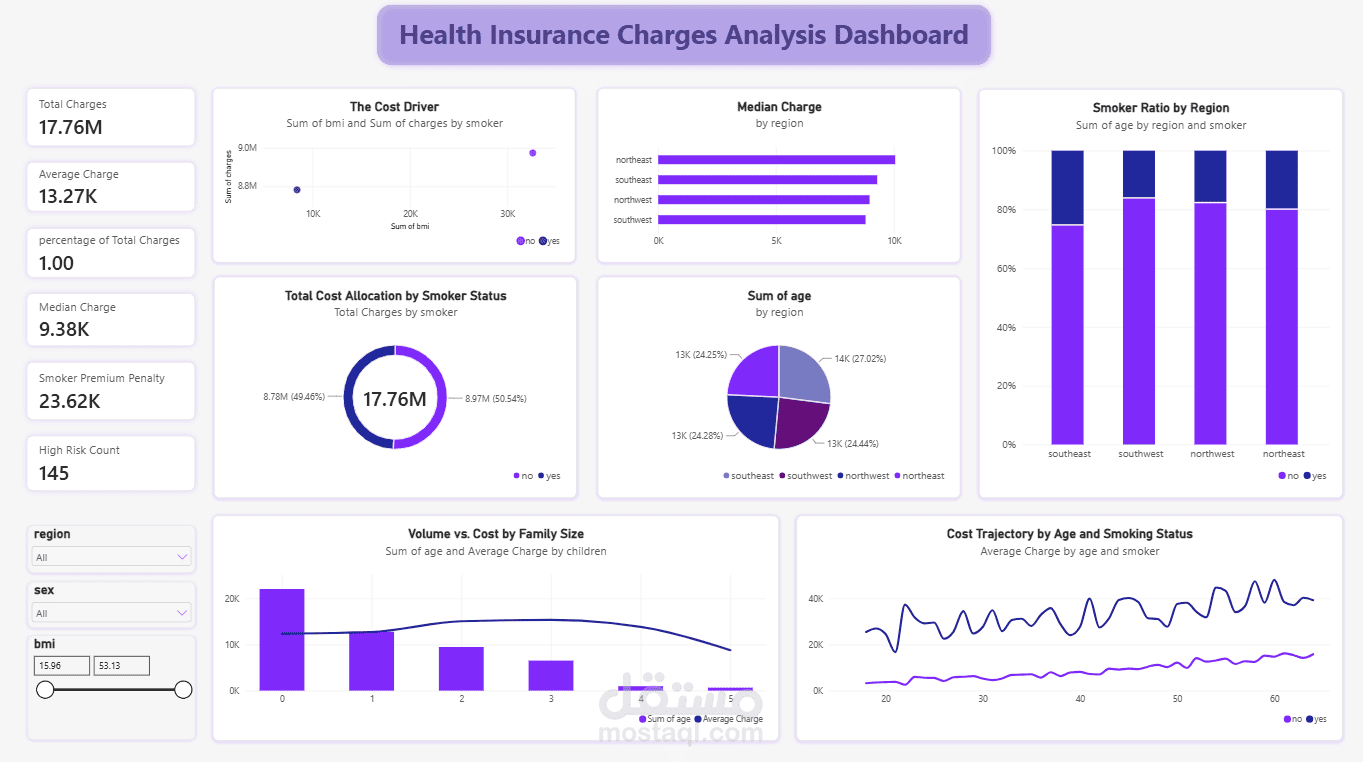
I just finished designing this Health Insurance Charges Analysis Dashboard, shifting my focus from corporate sales and HR into the complex world of healthcare and actuarial data. The objective here was to build a tool that doesn't just track costs, but actively identifies the underlying risk drivers behind $17.76M in medical billing.
Here is a technical breakdown of how I engineered this analytical model:
Data Architecture & Key Risk Metrics (KPI Engine)
Cost Profiling: Modeled out an average insurance charge of $13.27K versus a median of $9.38K, indicating a highly right-skewed dataset where severe medical cases pull the average up.
Quantifying Lifestyle Risk: Calculated a massive $23.62K Smoker Premium Penalty—representing the exact average dollar amount smokers cost over non-smokers.
High-Risk Isolation: Built logic to flag and isolate 145 High-Risk individuals based on overlapping thresholds (e.g., continuous BMI metrics and tobacco usage).
Analytical Findings & Visual Data Storytelling
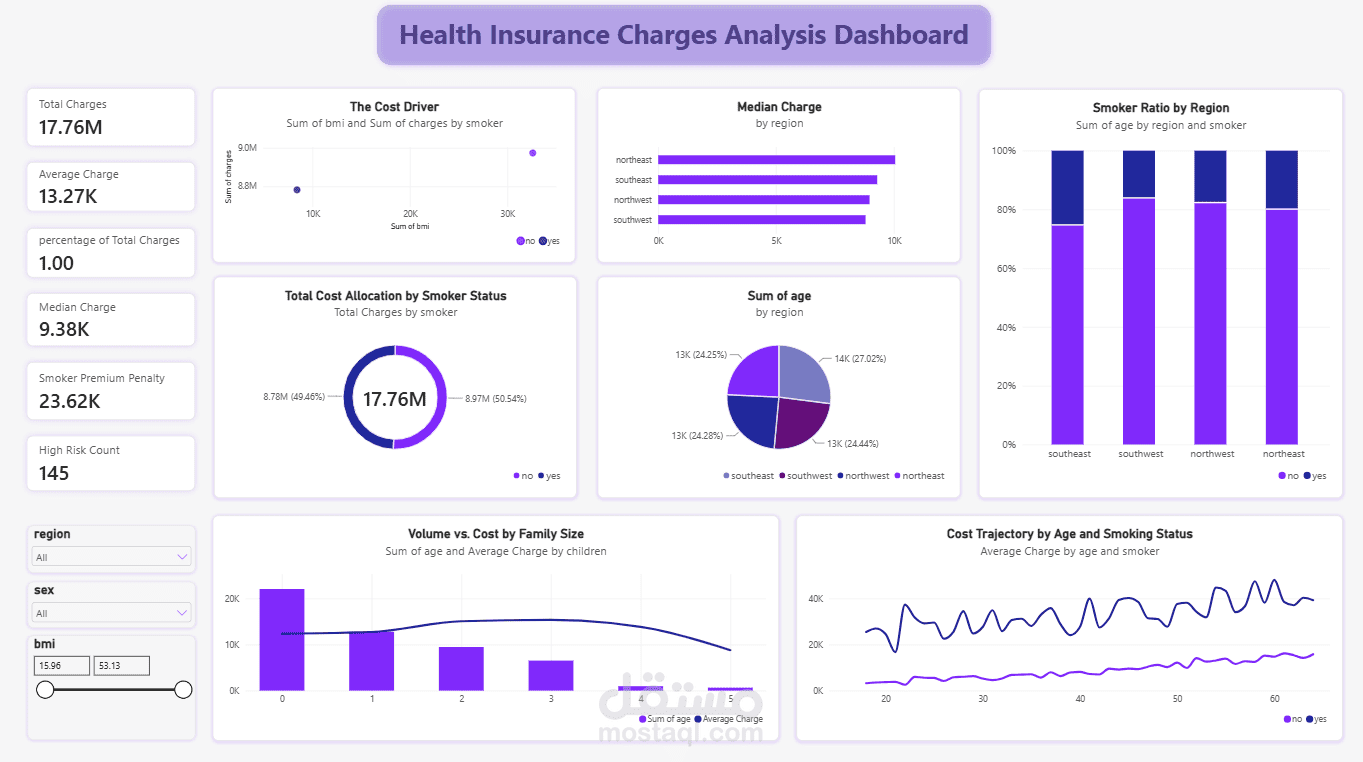
The Smoking Multiplier: Using a customized donut chart, I highlighted a staggering disparity: while non-smokers make up the vast majority of the population, smokers are responsible for over half (50.54% / $8.97M) of all aggregate health charges.
Cost Trajectory by Age: Engineered a dual-trendline area chart mapping age against medical costs. It clearly visualizes how age compounds insurance costs exponentially faster and higher for smokers compared to the baseline population.
Geographic Risk Distribution: Integrated 100% stacked bar charts and horizontal bar graphs to map out regional footprints. The Southeast region stands out with the highest smoker ratio (~25%), driving elevated median charges in that sector.
Family Size Impact: Deployed a combo chart to analyze volume against average charges across family sizes (0 to 5 dependents), mapping out how child-count impacts baseline medical claims.
UI/UX Design & Global Interactivity
Stepped away from dark mode for this project, utilizing a clean, clinical lavender/light aesthetic tailored for executive healthcare decision-makers.
Integrated continuous numeric filtering via a BMI Range Slider (15.96 – 53.13), alongside multi-variable dropdowns for Region and Sex, enabling underwriters to instantly stress-test different demographic cohorts.
Translating complex physiological and demographic variables into clear, actionable financial models is a fascinating challenge. Exploring the hidden stories in healthcare data has definitely been one of my favorite projects yet!