Project Management Performance Analysis
تفاصيل العمل
Project Title
Project Management Performance Analysis
Project Overview
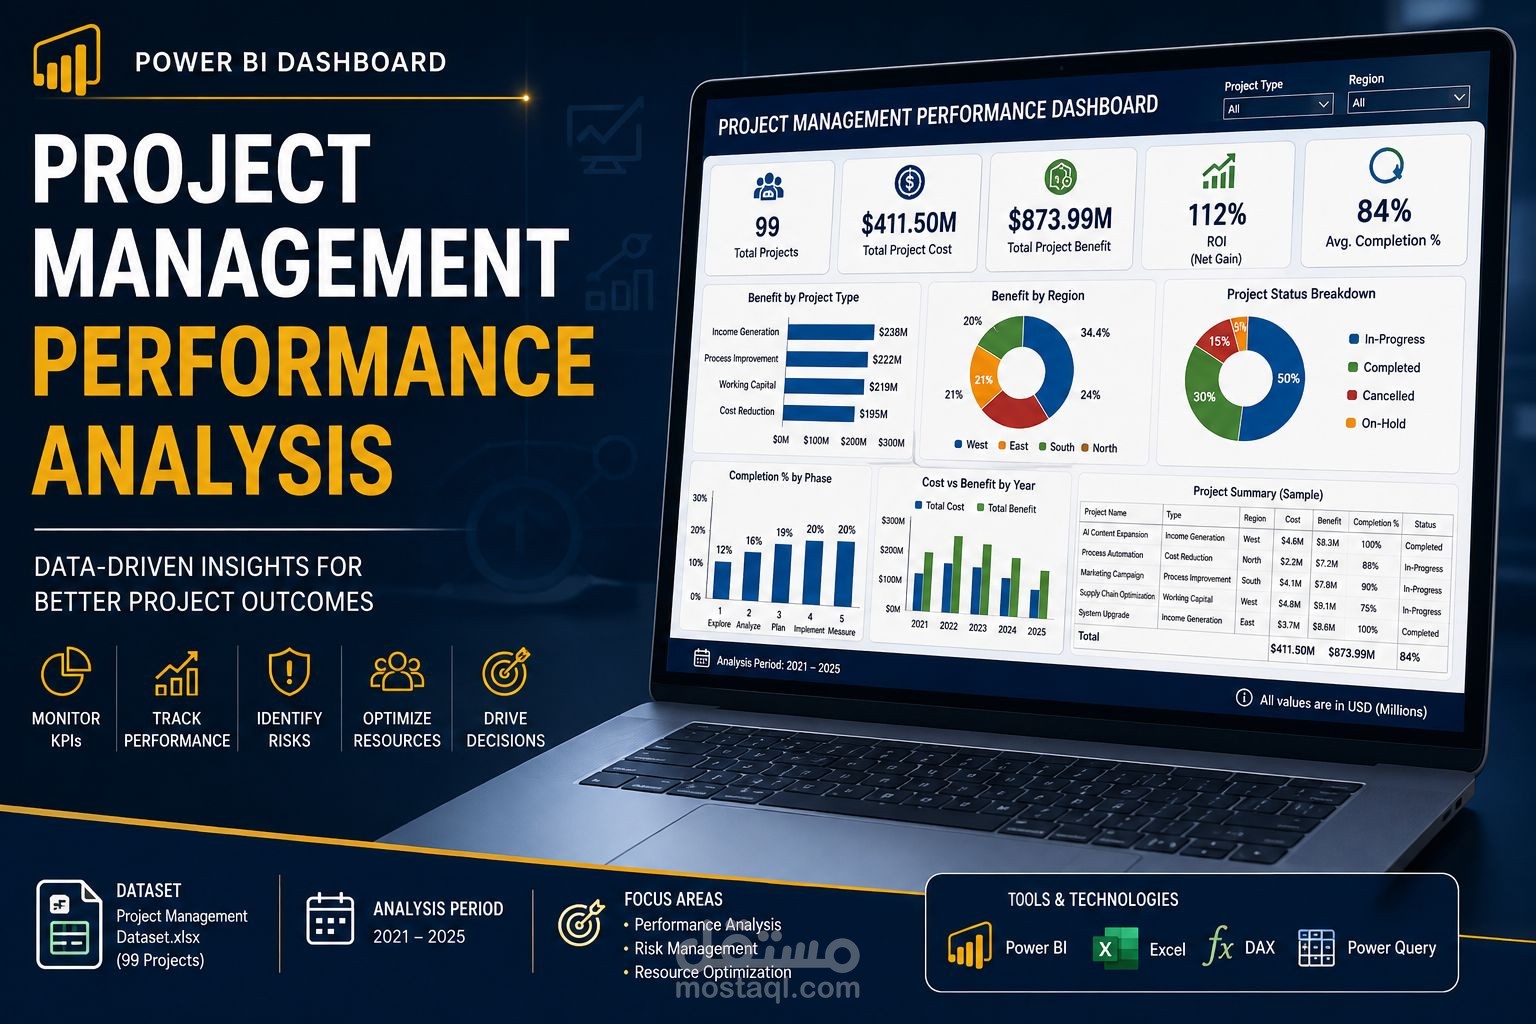
This project delivers an interactive Power BI dashboard analyzing 99 projects (2021–2025) with a total investment of $411.5M and projected benefits of $874M (ROI: ~112%). The dashboard enables management to monitor KPIs, track project phases, identify cancellation risks, and optimize resource allocation across regions and project types.
The goal is to provide insights for better resource allocation, risk management, and decision-making in project management. A Power BI dashboard was built to visualize KPIs, trends, and summaries, addressing key business questions derived from project management best practices (e.g., ROI, variance, efficiency).
Dataset Used
Source : Project Management Dataset.xlsx (single sheet with 99 rows of data); provided Excel file, no external data.
Columns : Project Name, Description, Type (e.g., Income Generation, Cost Reduction), Manager, Region (North, South, East, West), Department (e.g., Sales and Marketing, Supply Chain), Cost, Benefit, Complexity (High/Medium/Low), Status (In-Progress, Completed, Cancelled, On-Hold), Completion% (0–1), Phase (1–5: Explore to Measure), Year (2021-2025), Month, Start/End Date (Excel serial format).
Key Themes : Projects are AI/content marketing-focused but generalized for PM analysis; data covers financials, timelines, and statuses across 2021-2025.
Tools Used
Power BI : For data import, transformation, modeling, visualization, and dashboard creation (DAX for KPIs, slicers for interactivity).
Excel : Initial data exploration and validation.
Research Tools : Web searches on project management (e.g., PMBOK principles) to contextualize phases, KPIs, and best practices.
KPIs and Business Questions Answered
Key Performance Indicators (KPIs)
Total Projects: 99 (sample).
Total Project Cost: $411.50M.
Total Project Benefit: $873.99M (ROI: ~112% net gain).
Average Completion %: 84%.
On-Time Completion Rate: 40% (Completed projects).
Cost/Benefit by Type: Cost Reduction ($195M), Income Generation ($238M), Process Improvement ($222M), Working Capital ($219M).
Cost/Benefit by Region: West (34.4%, $301M), East (24%), South (21%), North (20%).
Completion by Phase: Phases 4 & 5 (~20% each), Phase 1 lowest (12%).
Yearly Trends: Benefits peak in 2022 (~ $0.24B) , decline to 2025 (~ $0.07B) ; similar for costs.
Status Breakdown: In-Progress (50%), Completed (30%), Cancelled (15%), On-Hold (5%).
Business Questions & Answers
1- What is the distribution of costs/benefits by project type? Income Generation leads benefits ($238M), but Cost Reduction has highest ROI (low cost, high savings).
2- How do regions compare in performance? West dominates (34% benefit, 34% cost) , East/South lag, suggesting resource reallocation.
3- What are completion trends by phase/year? Phases 4/5 at 20% each , benefits peak 2021–2023, decline in 2024–2025 due to in-progress projects.
4- Which departments/managers perform best? Sales & Marketing highest benefits , Managers like Nyasia Hunter oversee high-value projects.
5- Are there delays or cancellations? 20% cancelled/on-hold; average duration ~90 days, with high-complexity projects more prone to delays.
Transformation / Preparation / Data Cleaning Process
Imported Excel to Power BI via Power Query; converted serial dates (e.g., 44228) to proper dates using Date.FromExcelSerial (e.g., 02/01/2021).
Ensured data types: Cost/Benefit to Decimal, Completion% to Percentage, Year/Month to Whole Number.
Checked integrity: No nulls/duplicates/outliers , standardized statuses (e.g., "In - Progress" to "In-Progress") , trimmed descriptions , validated no negative costs/benefits.
Added columns: Duration = End Date - Start Date , ROI = (Benefit - Cost) / Cost.
Calculated DAX measures (e.g., Total Cost = SUM([Project Cost]), ROI = ([Total Benefit] - [Total Cost]) / [Total Cost]).
Created relationships (e.g., Year to filters) .
Data Model: Star schema with fact table (projects) and dimensions (type, region, phase).
Filtered outliers (none major) , grouped by type/region for aggregations.
Exploratory Data Analysis
Descriptive Stats: Costs range $3M–$5M avg , benefits $8M–$9M avg; 50% high complexity.
Correlations: High complexity correlates with delays (lower completion %) , Income Generation types have highest benefits , Completed projects have higher benefits.
Trends: Benefits stable 2021–2023 (~$200M/year), dip in 2024–2025 (incomplete data) , West region outperforms (higher ROI) , benefits decrease post-2022, possibly due to more cancellations.
Distributions: 40% Income Generation , 30% Completed , Phases evenly spread but Phase 1 lowest completion.
Summarized totals: High ROI overall , West region dominates (34% benefits) , High-complexity projects ~60% of total.
Outliers: Few cancelled with high costs (~15% of projects).
Dashboard
Interactive single-page dashboard with slicers (Project Name, Type, Region).
Visuals: KPI cards (by type), pie charts (benefit/cost by region), bar chart (completion % by phase), table (project summary), clustered bar (cost/benefit by year).
Full Power BI Dashboard View
Data Analysis
Aggregated via DAX: SUM(Project Benefit) by Region/Type , AVERAGE(Completion%) by Phase.
Financial: Net benefit $462.5M , Income Generation most profitable.
Regional: West leads (34% benefits) , North lowest, suggesting reallocation.
Phase/Status: Phases 4-5 advanced; 15% cancellations indicate risks in early phases (1–2 bottleneck completion).
Trends: ROI positive overall (112%), but cancellations in high-cost projects erode gains;
Yearly: Peak performance 2022 , 2025 projections lower, with more In-Progress.
Comparisons: West/Sales & Marketing excel , High-complexity projects (50%) have 25% cancellation rate , 2025 projects in-progress skew trends.
Complexity: High-complexity (70%) drives 80% costs/benefits.
Results
Net Benefit: $462.49M ($874M benefits - $411.5M costs).
Top Performer: Income Generation (27% projects, 27% benefits).
Top Region: West (34% benefits).
Underperformers: East region (21% benefits but 24% costs) , Cancelled projects cost ~$100M lost (15 projects, ~$60M with minimal benefits).
Completion: 84% avg, with 40% fully completed; Strong ROI (112%), but declining trends post-2022.
Cancellations: 15% of projects.
Project Insights
Strong ROI but inefficiencies in cancellations/delays, especially high-complexity; positive financials, but regional imbalances and declining yearly benefits signal potential inefficiencies or market shifts.
Regional imbalances: West drives value; others need support.
Phase bottlenecks: Focus on early planning to boost completion; Early phases (1-2) need better planning to reduce holds/cancellations.
Yearly decline: 2024–2025 projections lower due to ongoing projects—monitor closely.
High-complexity projects yield high returns but higher risks (more cancellations).
Overall, focus on scalable types like Income Generation for sustained growth.
Recommendations
Prioritize low/medium complexity for faster ROI , train on risk management , enhance early phases with agile methods to reduce delays.
Reallocate to West/Sales , investigate East/South underperformance , Prioritize West/North regions for new projects.
Cancel high-risk projects early , aim for >90% on-time rate , Reduce cancellations via better risk assessment in Phase 1.
Update dashboard quarterly for real-time tracking , Enhance dashboard with alerts for low-completion projects.
Monitor yearly declines , forecast 2026 with scenario analysis , Research PM best practices (e.g., agile for high-complexity) to boost efficiency.