amazon-sales-analytics-dashboard-
تفاصيل العمل
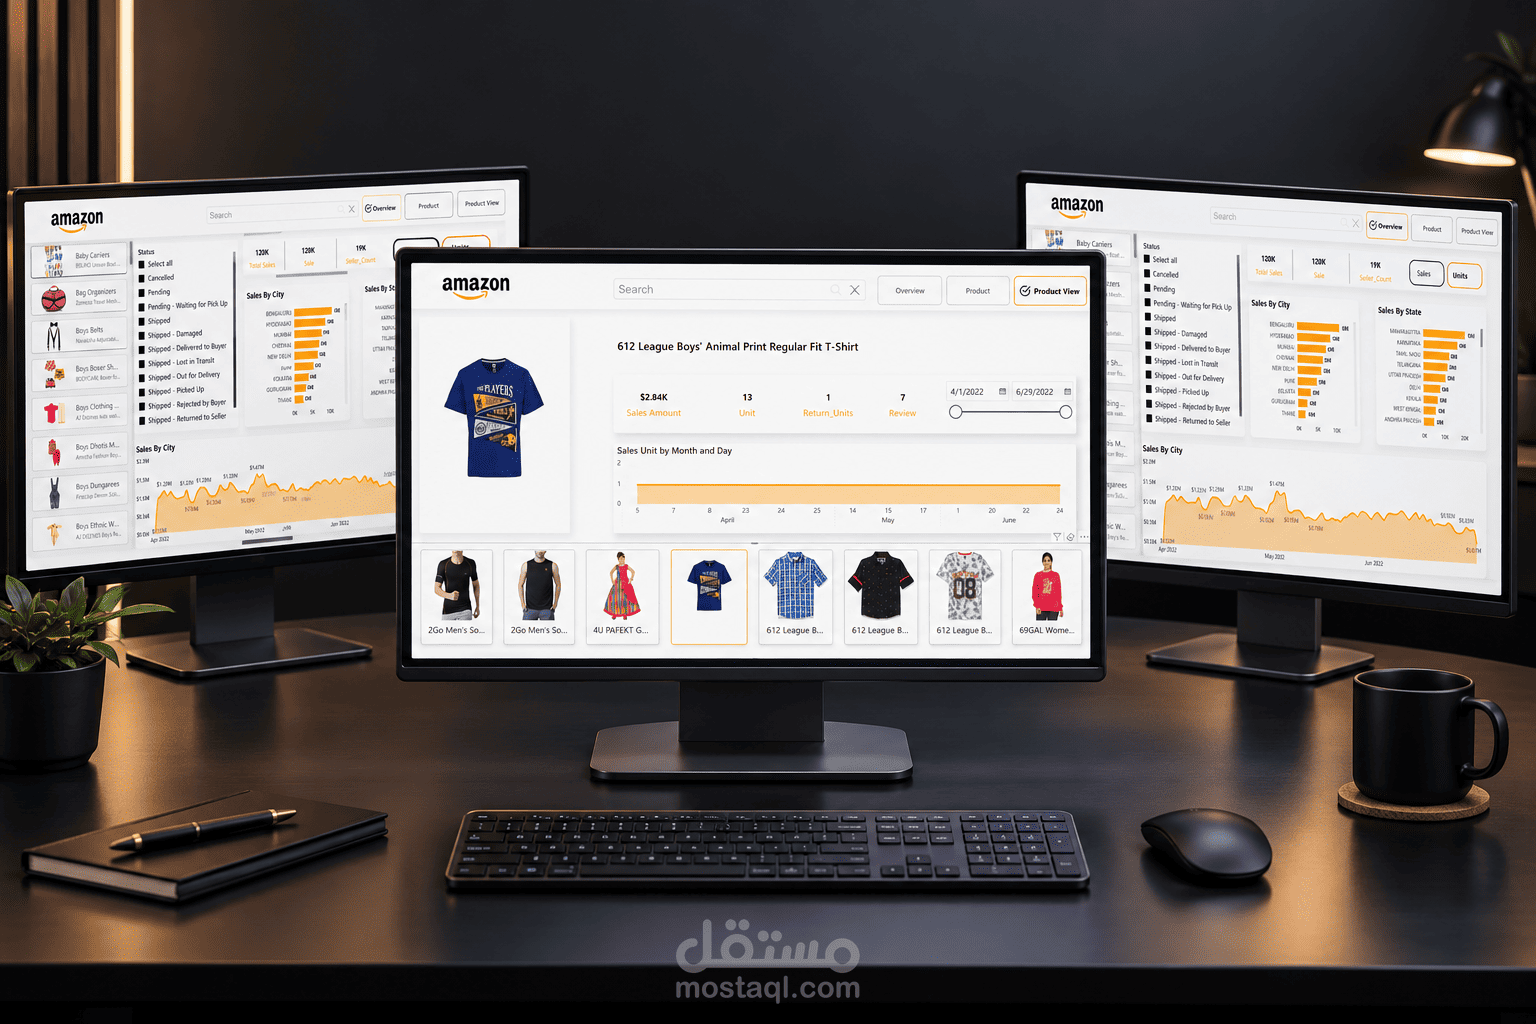
The **Amazon Sales Dashboard** is an interactive Power BI project designed to analyze and visualize Amazon sales performance across products, cities, states, sellers, and order statuses.
This dashboard transforms raw e-commerce data into meaningful business insights through dynamic KPIs, trend analysis, and geographical visualizations. It helps stakeholders monitor performance, identify sales patterns, and make data-driven business decisions efficiently.
---
#Dashboard Features
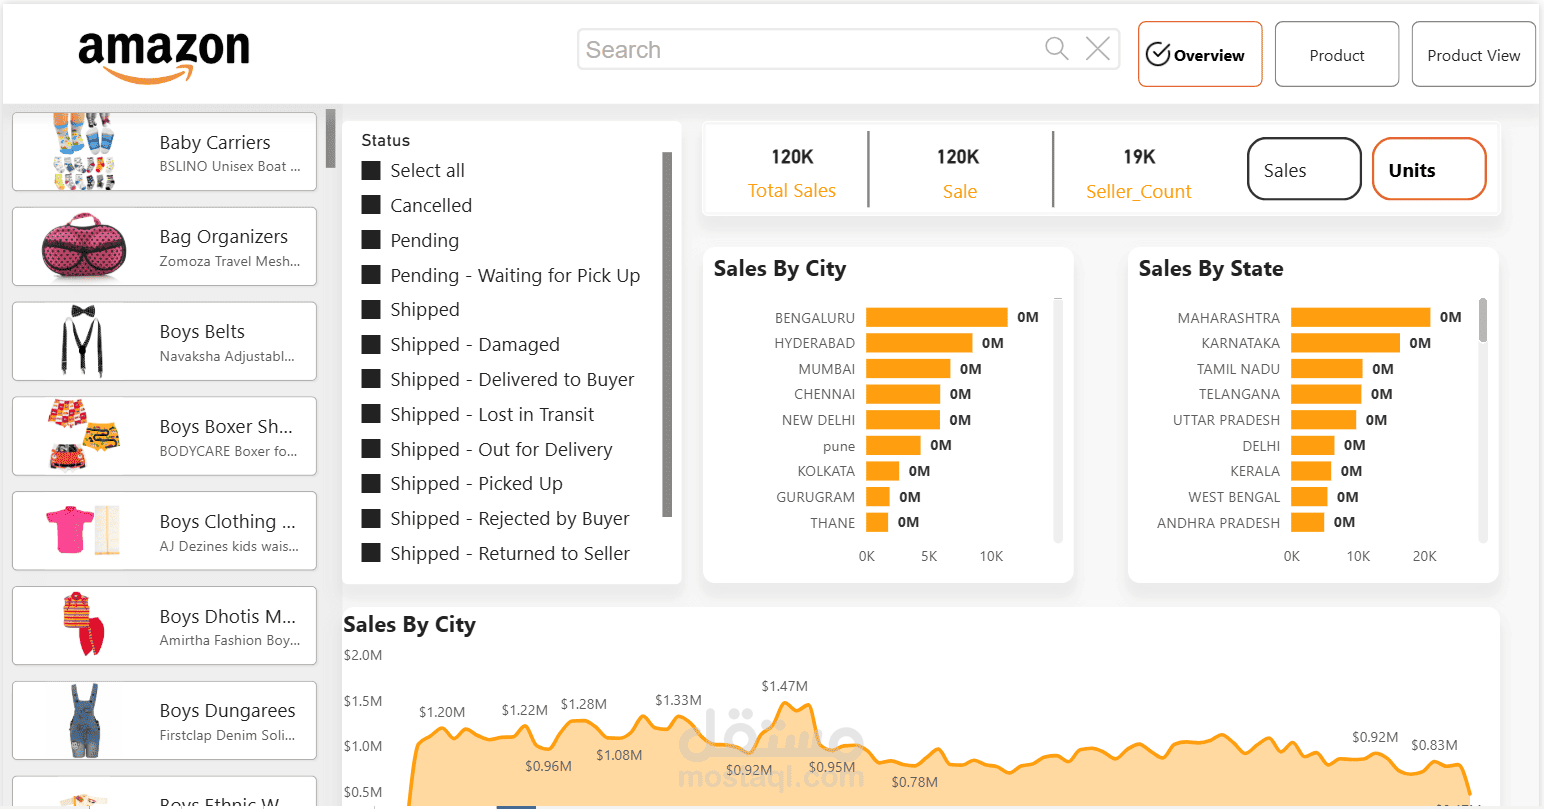
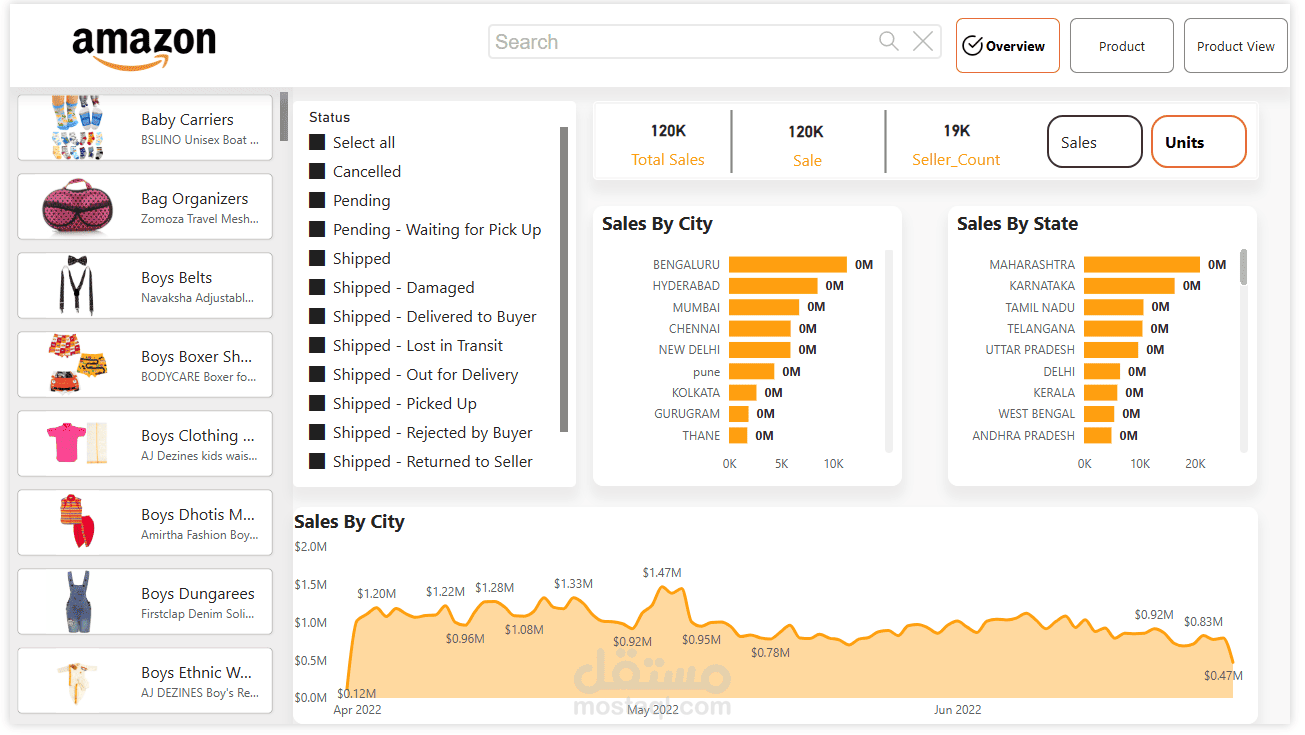
## Overview Page
The Overview page provides a high-level summary of sales performance with:
* Total Sales KPI
* Seller Count Analysis
* Order Status Filtering
* Sales by City
* Sales by State
* Interactive Product Slicer
* Time-based Sales Trend Analysis
### Key Insights:
* Track overall business growth
* Identify top-performing cities and states
* Analyze shipment and delivery status
* Monitor daily sales fluctuations
---
## 🔹 Product Page
The Product page focuses on product-level analysis and performance tracking.
### Includes:
* Product-wise sales analysis
* Product category insights
* Revenue contribution by products
* Product performance comparison
* Seller-level breakdown
---
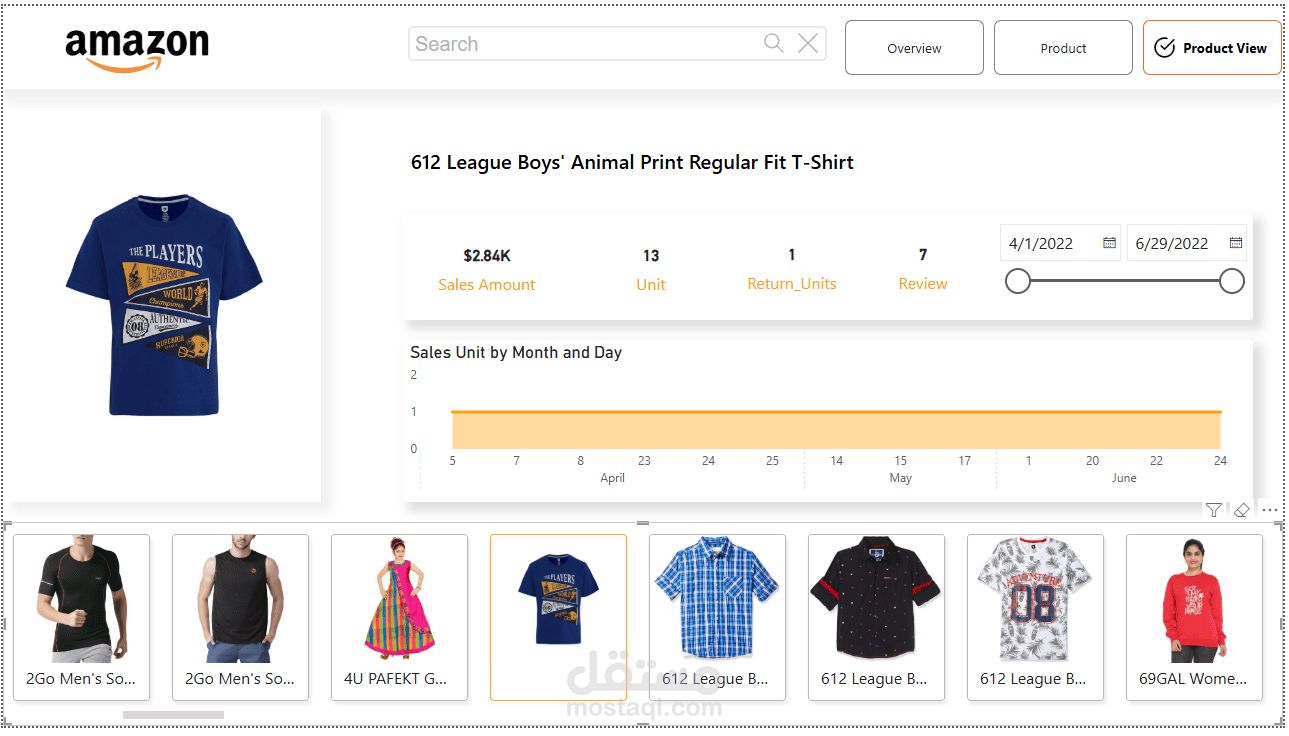
# Product View Page
This page provides a detailed visual breakdown of selected products.
### Includes:
* Product-specific KPIs
* Product trend analysis
* Detailed filtering experience
* Dynamic visual interaction
---
## 🔹 Product Tooltip Page
A custom tooltip page designed to enhance user interaction.
### Features:
* Dynamic hover tooltips
* Additional contextual insights
* Cleaner report navigation experience
---
Project Objectives
The primary objectives of this project are:
* Analyze Amazon sales performance efficiently
* Identify high-performing regions and products
* Monitor shipment and delivery status
* Create interactive business intelligence reports
* Improve decision-making using data visualization