Omnichannel Retail Sales & Profitability BI Suite
تفاصيل العمل
Goal & Challenge:
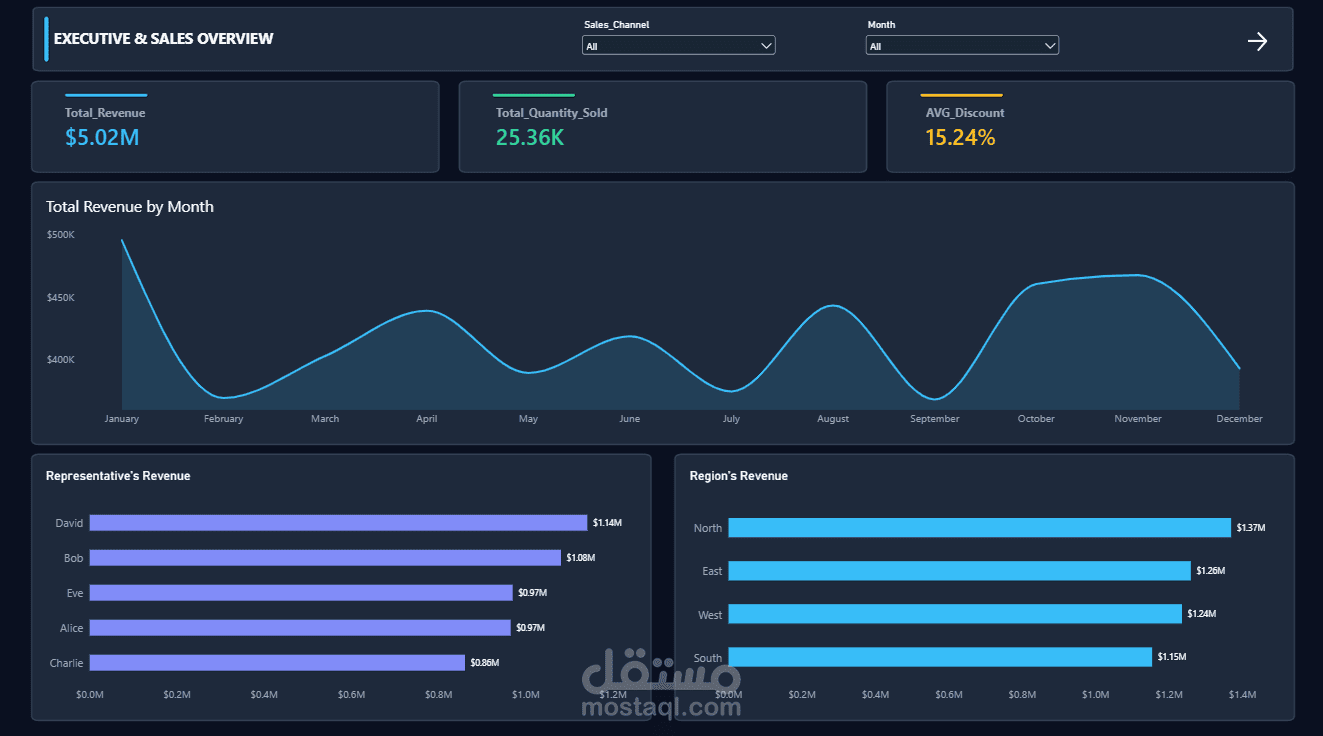
Clean fragmented retail sales records, engineer unit-profit metrics, and analyze $5M+ in revenue across 4 regions, sales reps, and omnichannel channels (Online vs. Retail).
My Role:
End-to-End Data Analyst & BI Developer: Authored Python preprocessing pipelines, structured 9 analytical SQL queries, formulated DAX measures, and designed executive Power BI visuals.
Method & Tools:
Python (Pandas) for data cleaning and profit feature engineering, SQL Server (SSMS) for aggregations and ranking, and Power BI Desktop for interactive multi-dimensional reporting.
Result & Impact:
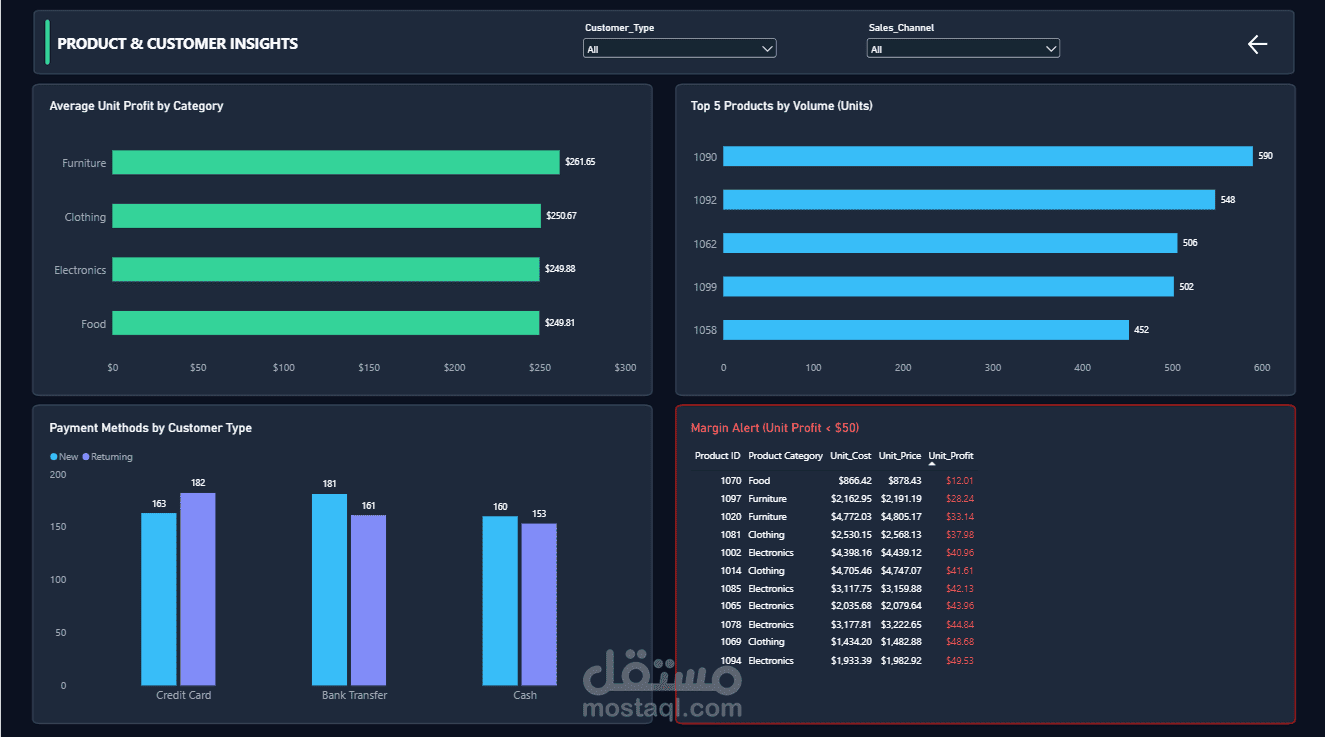
Analyzed 1,000 transactions ($5.02M revenue, 25.3K units sold), identified top revenue driver (North Region: $1.37M) and most profitable category (Furniture avg profit: $261.65/unit).