Interactive Sales Performance Dashboard using Power BI
تفاصيل العمل
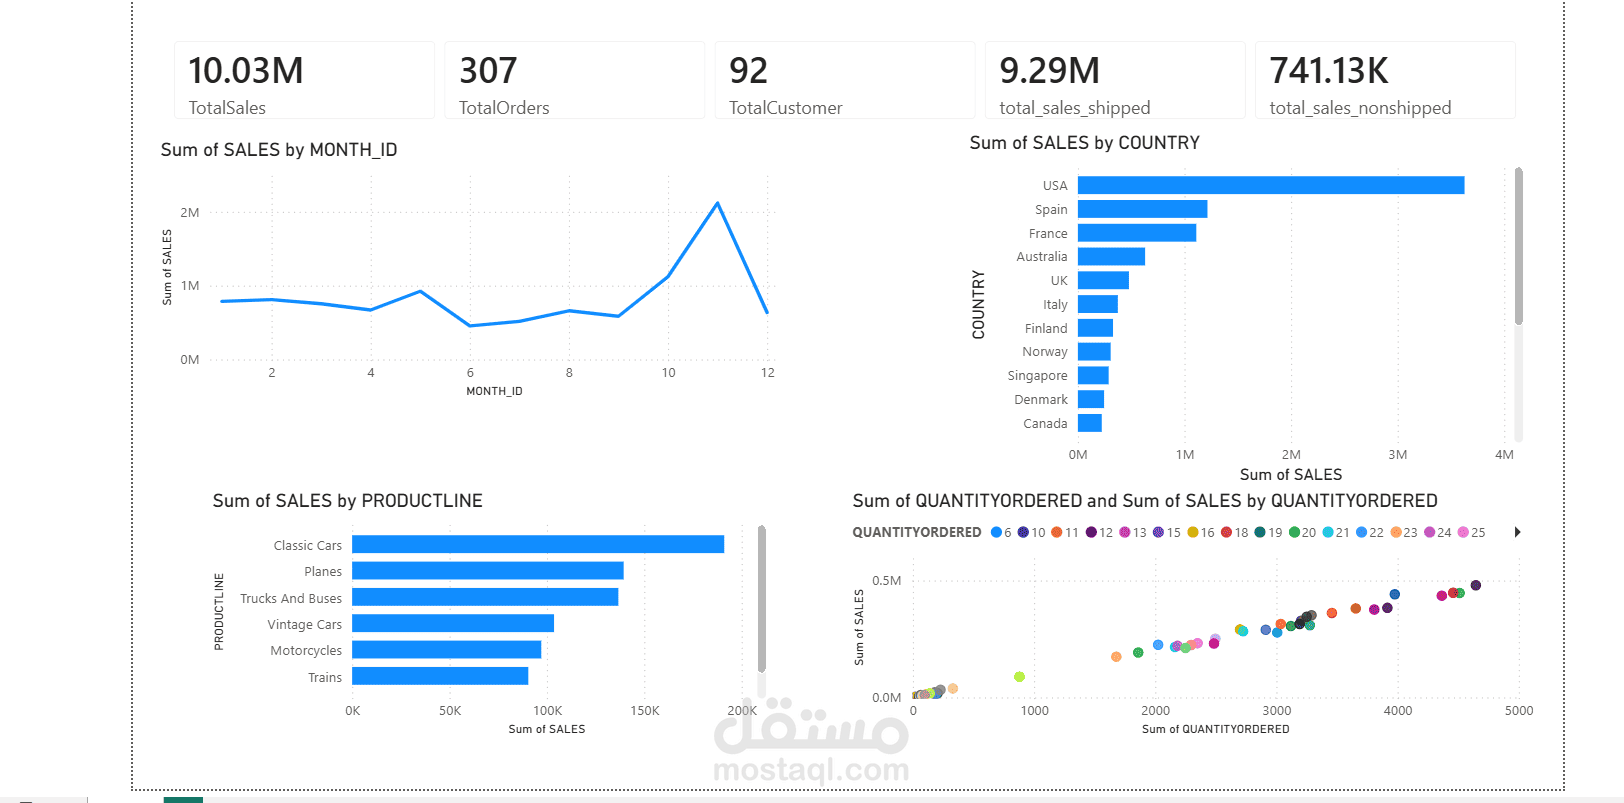
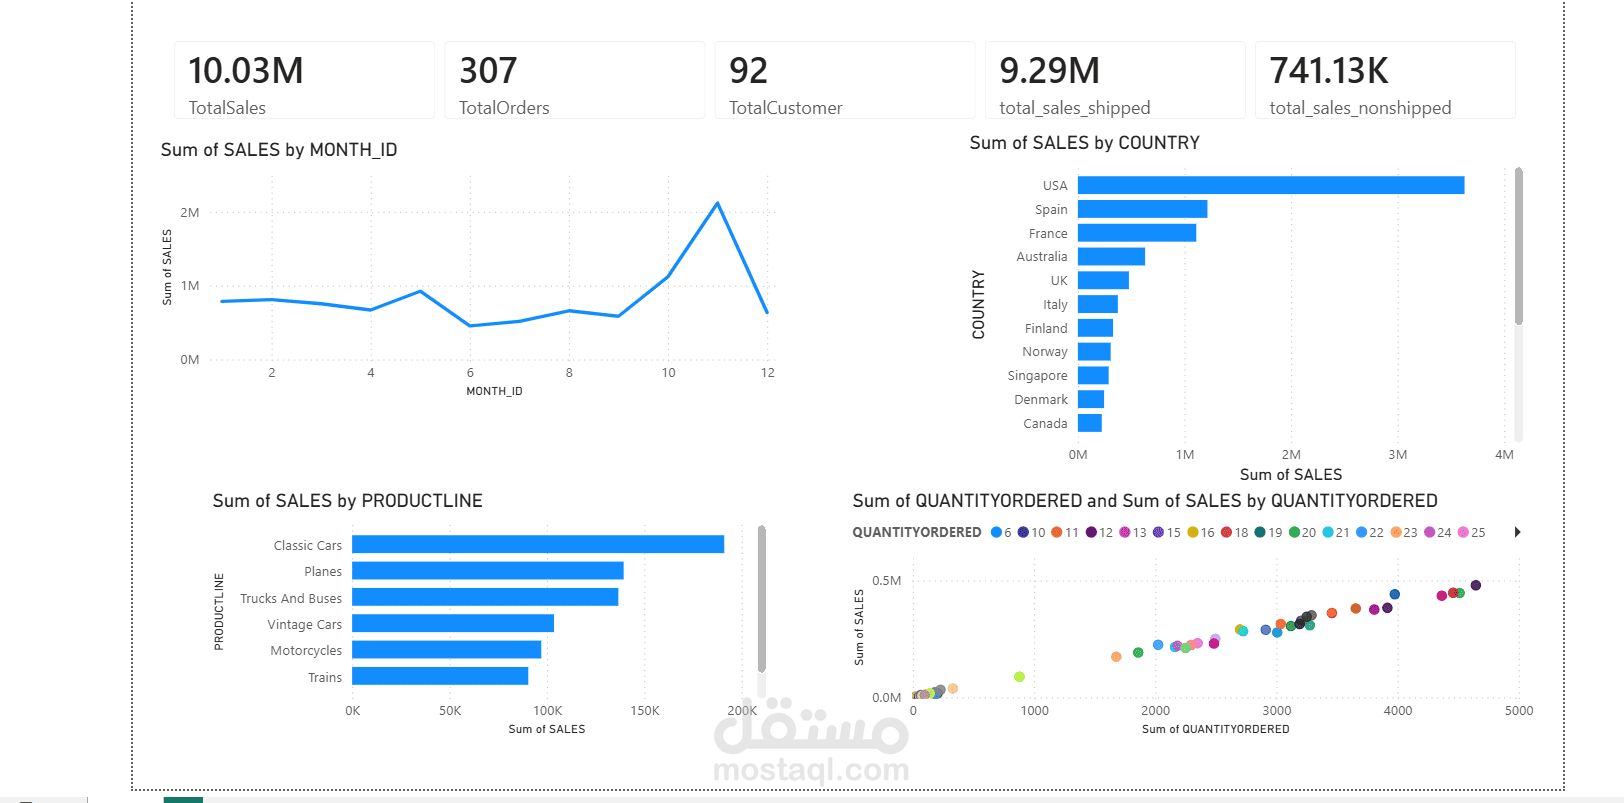
Designed and developed an interactive Sales Analysis Dashboard using Microsoft Power BI to monitor and analyze business performance.
The dashboard provides a comprehensive overview of key sales metrics, including Total Sales, Total Orders, Total Customers, Shipped Sales, and Non-Shipped Sales.
It also analyzes sales performance across different months, countries, product lines, and quantities ordered. Interactive visualizations were created to identify sales trends, top-performing countries and product categories, and the relationship between quantity ordered and sales.
The dashboard helps businesses gain actionable insights into sales performance and supports data-driven decision-making.