Healthcare KPI Dashboard & Data Analysis Using Excel
تفاصيل العمل
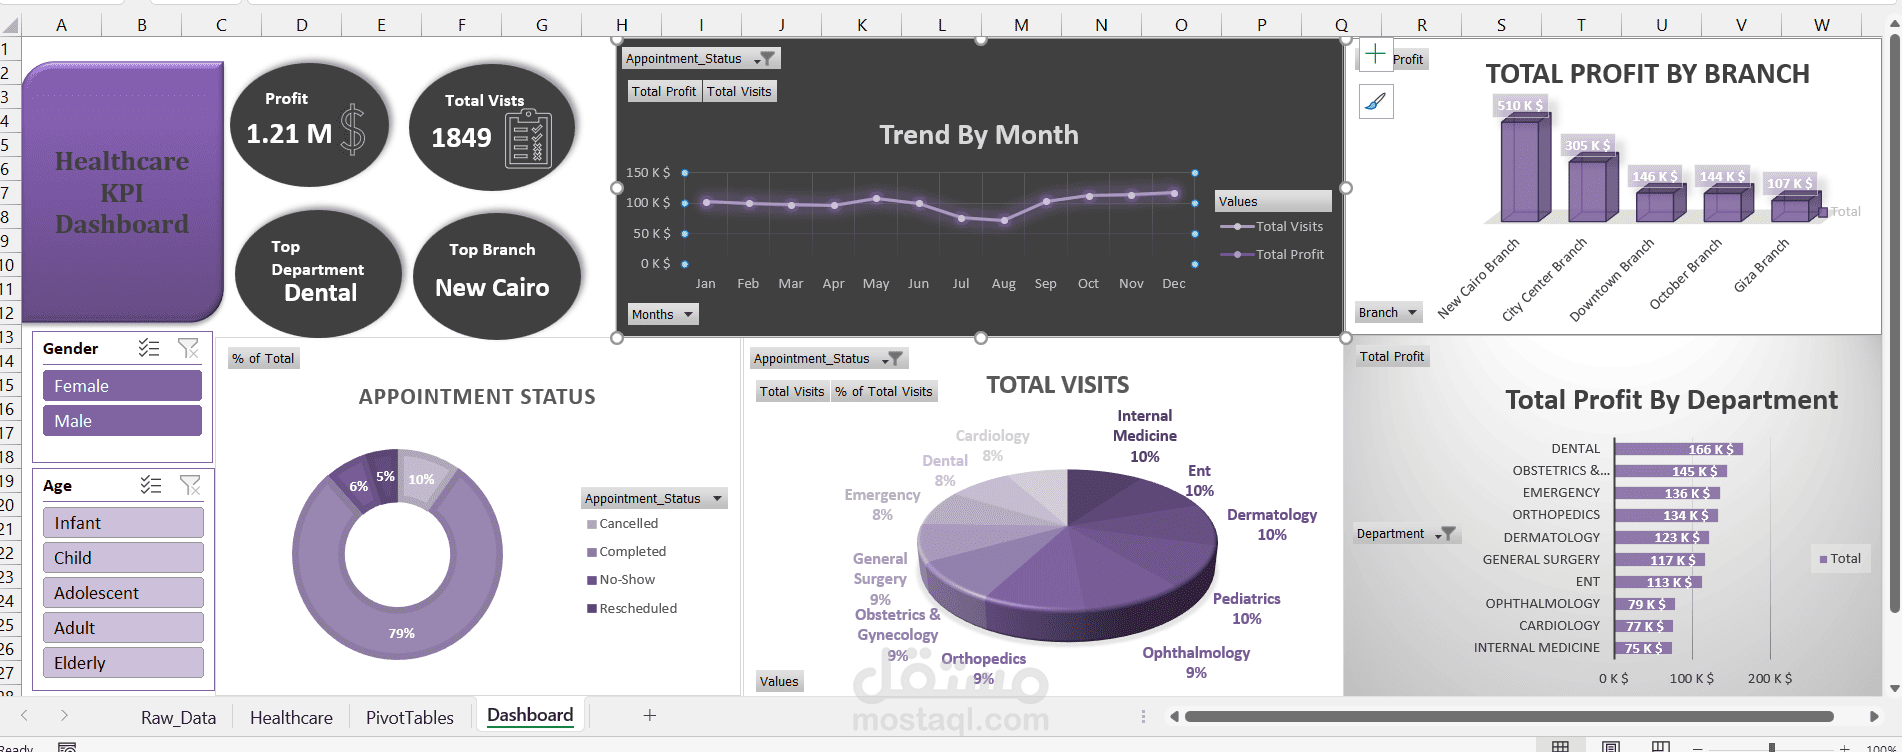
Developed an interactive Healthcare KPI Dashboard using Microsoft Excel to analyze and visualize healthcare appointment and operational data.
The project included:
• Cleaning and organizing a dataset of 2,350 healthcare appointment records.
• Analyzing key healthcare KPIs such as total visits, completed appointments, cancellations, and no-shows.
• Analyzing patient demographics, including age groups and gender.
• Evaluating waiting time and consultation duration.
• Analyzing performance across different departments, doctors, and branches.
• Analyzing revenue, discounts, and net revenue.
• Creating Pivot Tables and interactive visualizations to make data easier to understand.
• Designing an interactive dashboard that helps healthcare management identify trends and monitor operational performance.
Tools & Skills:
Microsoft Excel | Data Cleaning | Data Analysis | Pivot Tables | KPI Analysis | Data Visualization | Healthcare Analytics | Dashboard Design