Sales Performance Dashboard | Excel Data Analysis
تفاصيل العمل
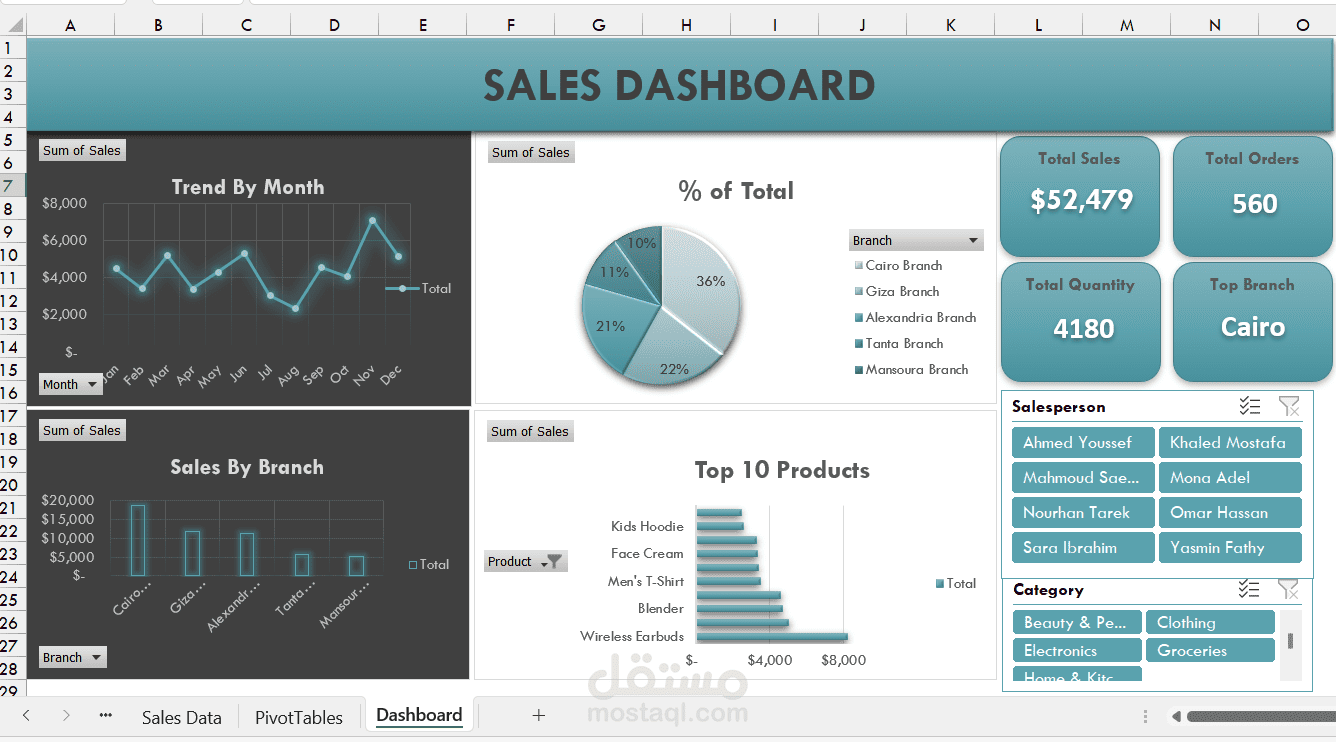
I designed and developed an interactive Sales Performance Dashboard using Microsoft Excel to transform raw sales data into clear, actionable business insights.
The dashboard provides an easy-to-use interface for monitoring sales performance, analyzing trends, and exploring key business metrics through interactive visualizations and filters.
Key Features:
• Interactive KPI dashboard
• Sales performance and trend analysis
• Dynamic Pivot Tables and Pivot Charts
• Interactive Slicers and filters
• Clear and professional data visualization
• Organized and user-friendly dashboard layout
• Data analysis and performance monitoring
Tools & Skills:
Microsoft Excel | Pivot Tables | Pivot Charts | Slicers | Data Analysis | Data Visualization