Saudi tourism interactive BI Dashbord
تفاصيل العمل

Overview
This case study analyzes tourism and hospitality performance across Saudi Arabia, focusing on key performance indicators, regional differences, and tourism workforce trends during Q1 2026.
The analysis transforms a large statistical dataset into an interactive Power BI dashboard to support regional comparison, performance monitoring, and data-driven insights.
Business Context
Saudi Arabiaˇs tourism and hospitality sector is a key part of the countryˇs economic diversification and Vision 2030 goals. As tourism activity continues to grow, understanding hospitality performance, regional differences, and workforce trends is essential for monitoring sector performance and identifying areas of opportunity.
Analytical Objectives
To analyze tourism and hospitality performance across Saudi Arabiaˇs 13 administrative regions by evaluating occupancy rates, average daily rates, average length of stay, and tourism workforce trends, and to translate these measures into an interactive Power BI dashboard for regional comparison and performance monitoring.
Key Performance Indicators
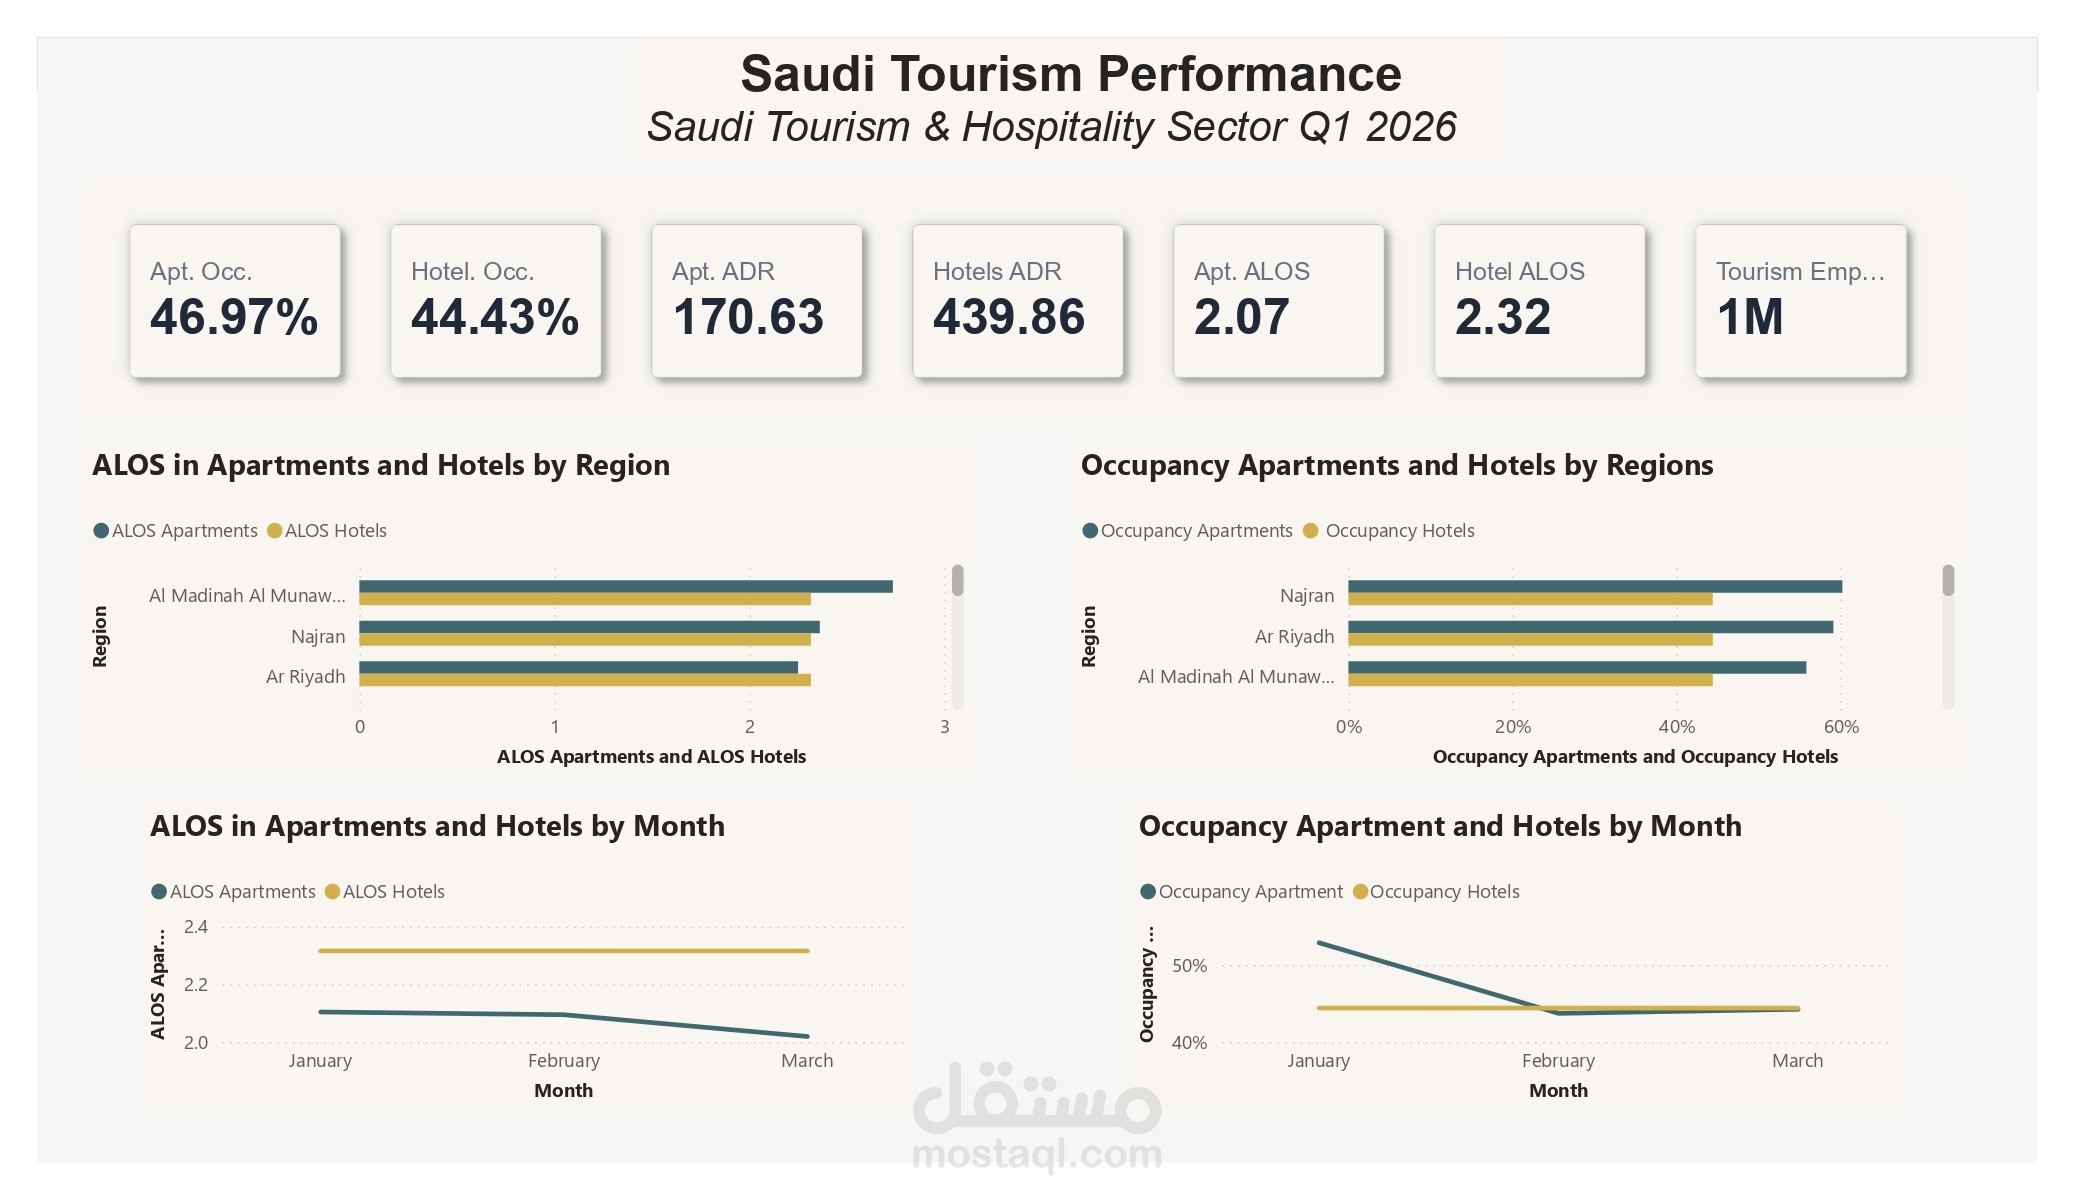
The analysis focuses on four core performance indicators used to evaluate tourism and hospitality performance and workforce trends as shown in the figure below
Key Business Questions
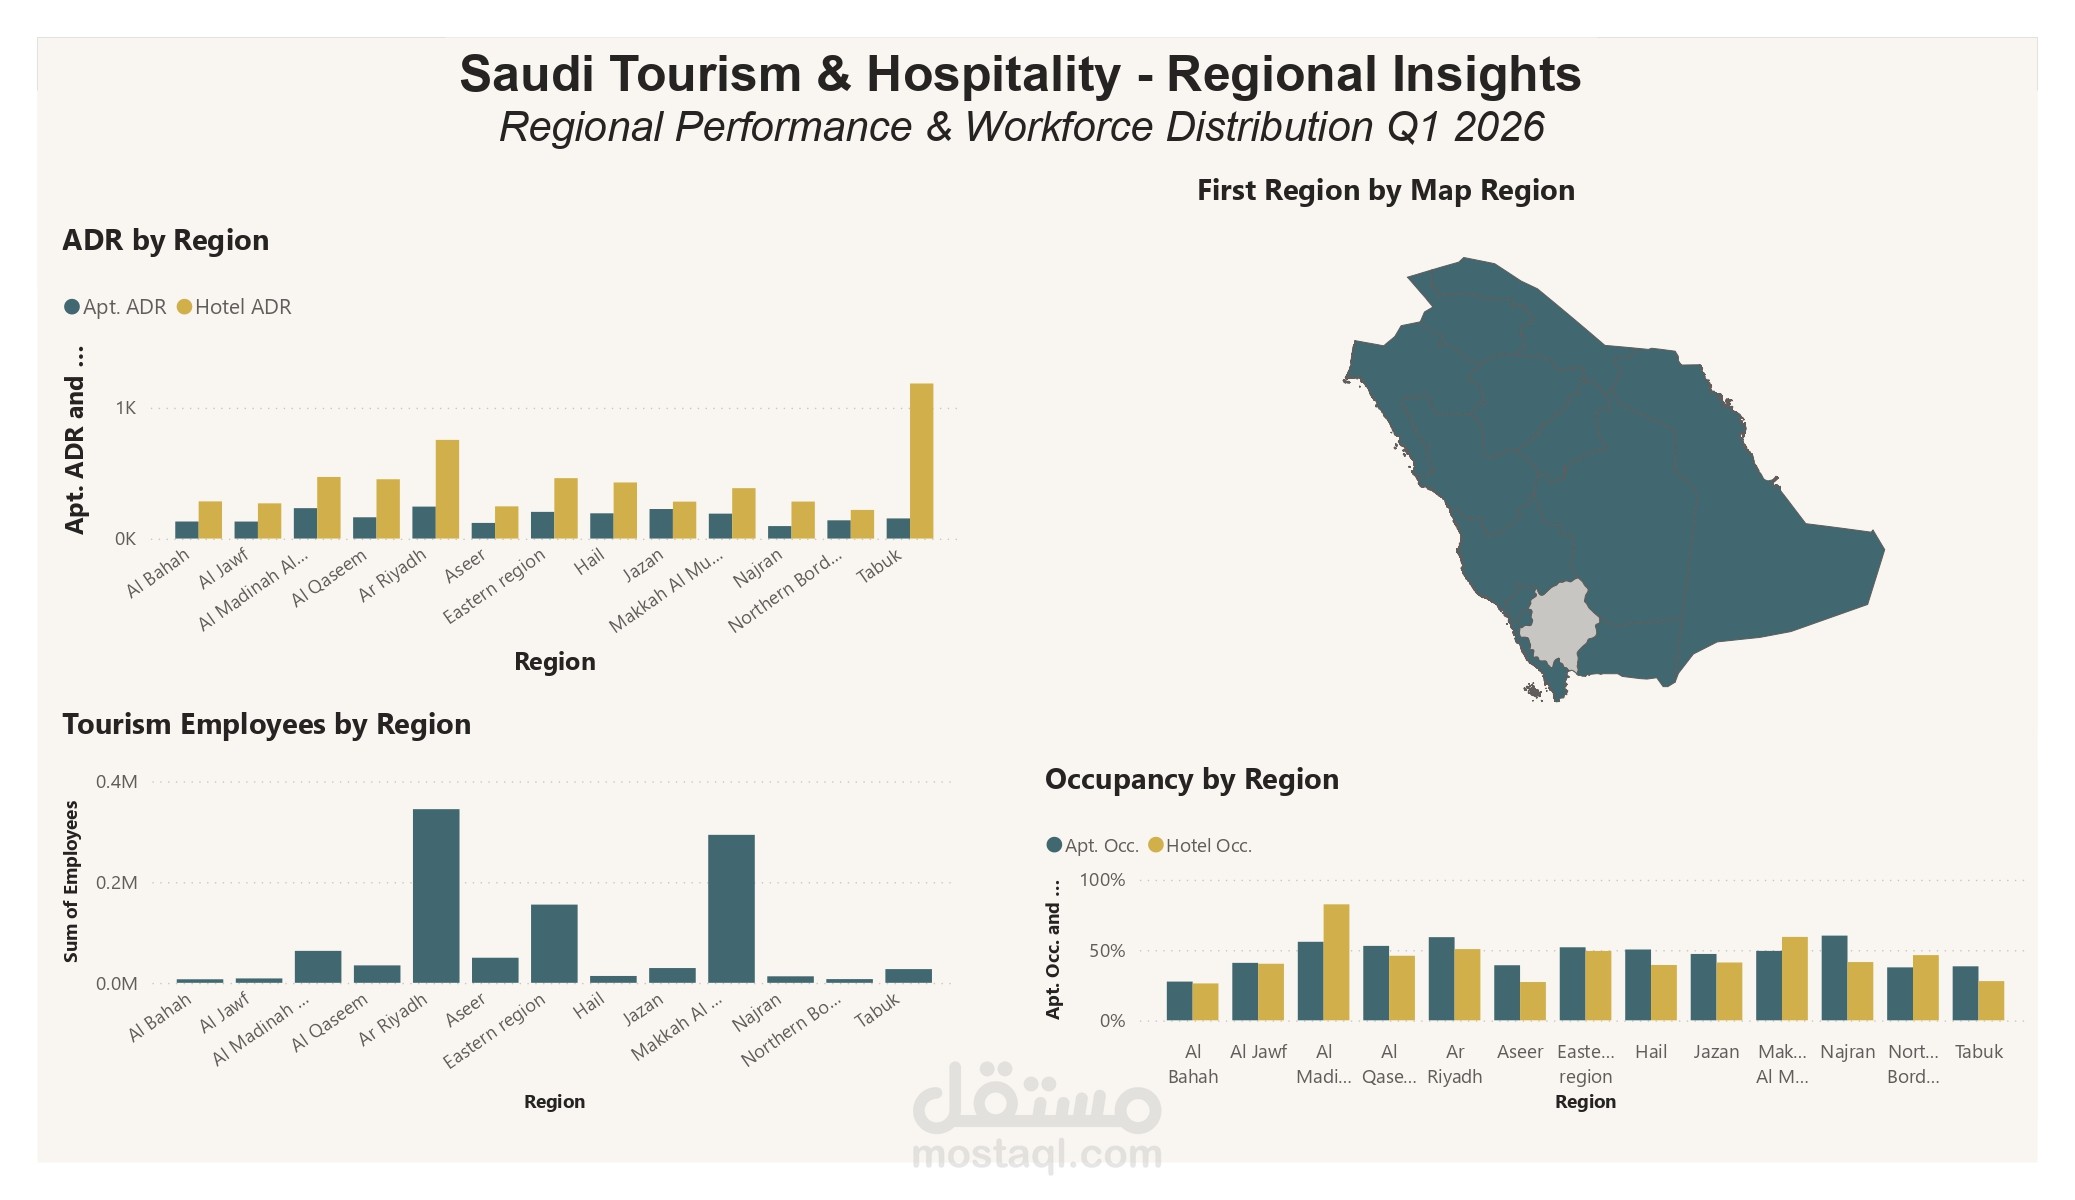
How does€occupancy rate€vary across regions and between accommodation types?
How does€ADR (Average Daily Rate)€differ across regions and accommodation types?
How does€ALOS (Average Length of Stay)€vary across regions and accommodation types?
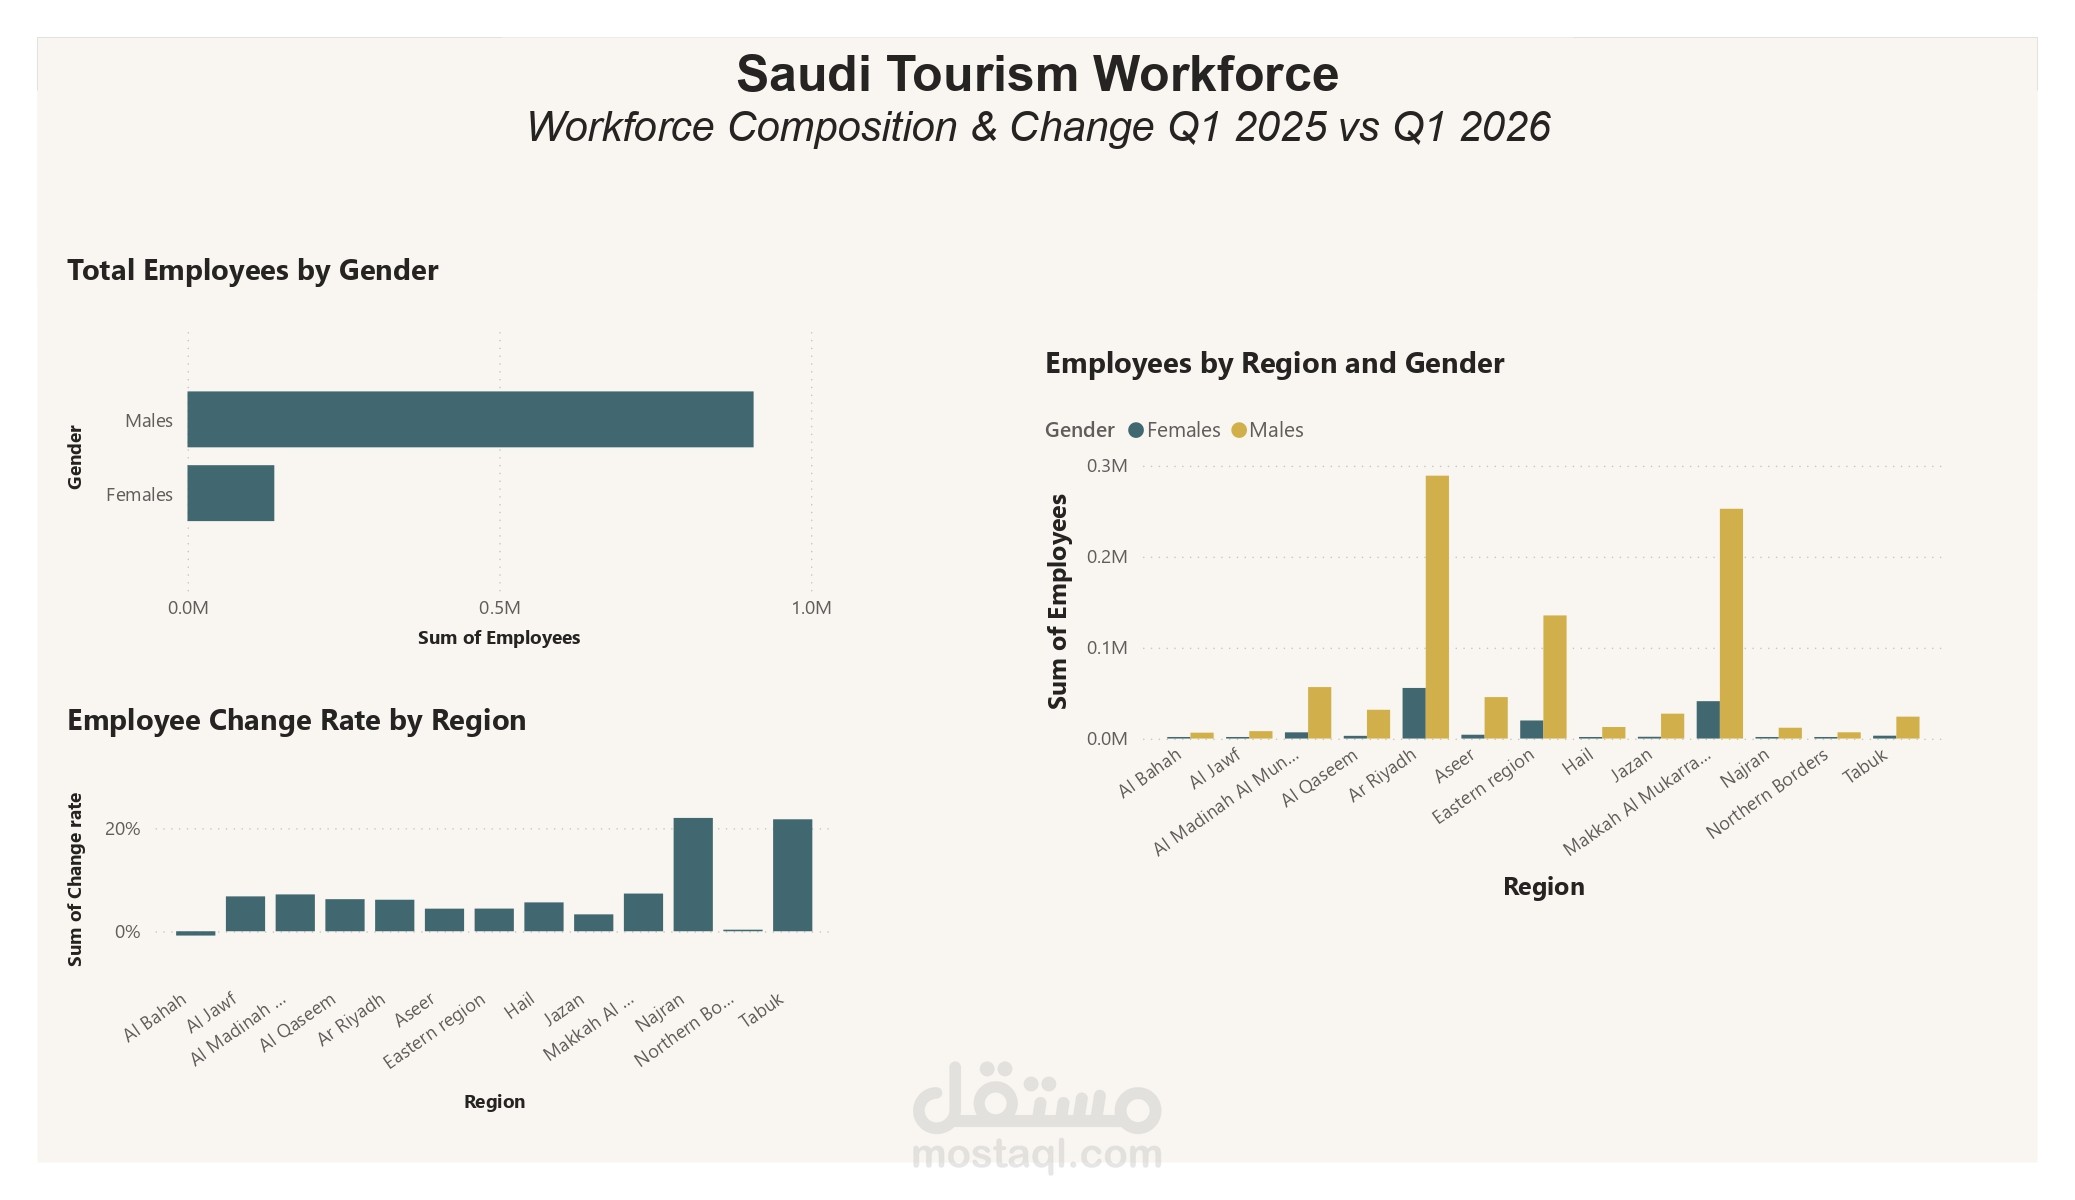
How is the€tourism workforce€distributed across regions and by gender?
How has the€tourism workforce changed€compared with Q1 2025?
Which regions show notable differences in tourism and hospitality performance?