Sales Dashboard
تفاصيل العمل
Sales Dashboard – Power BI
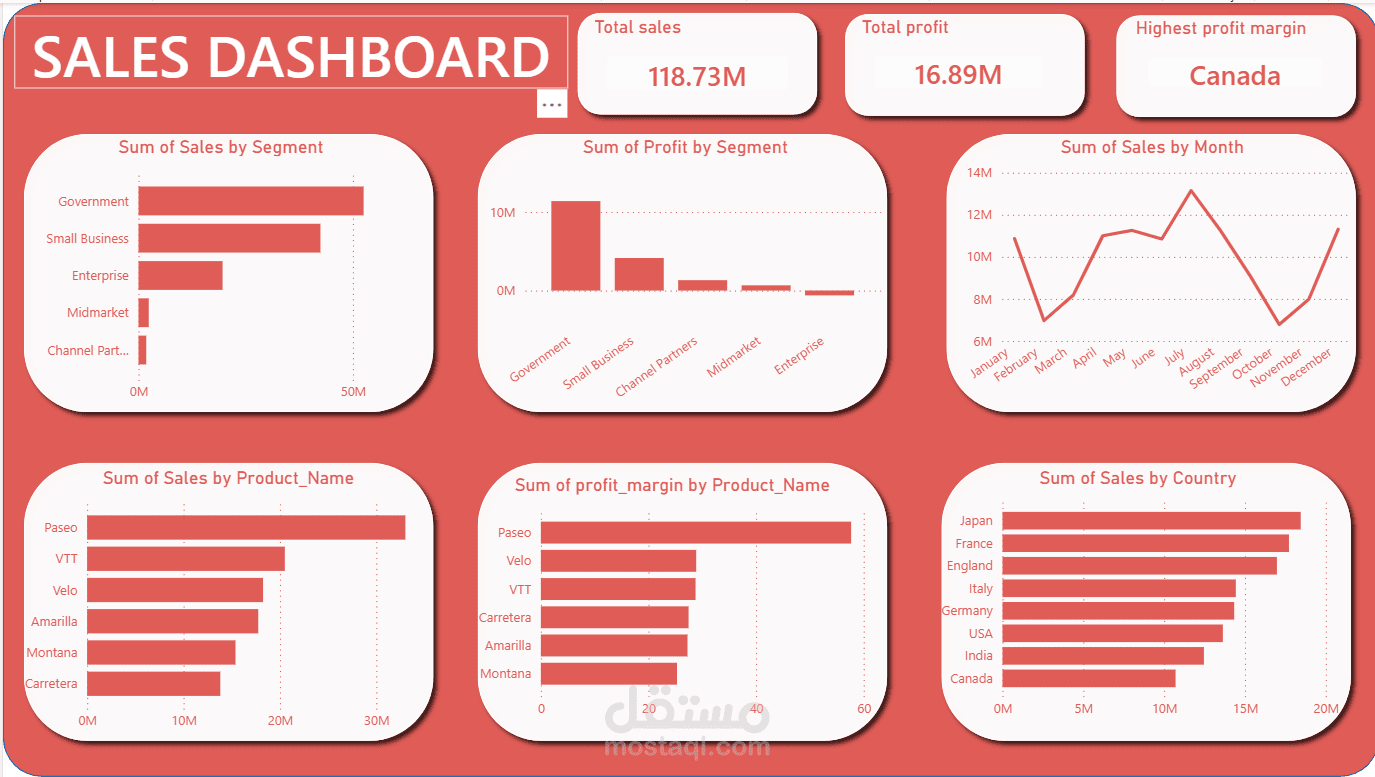
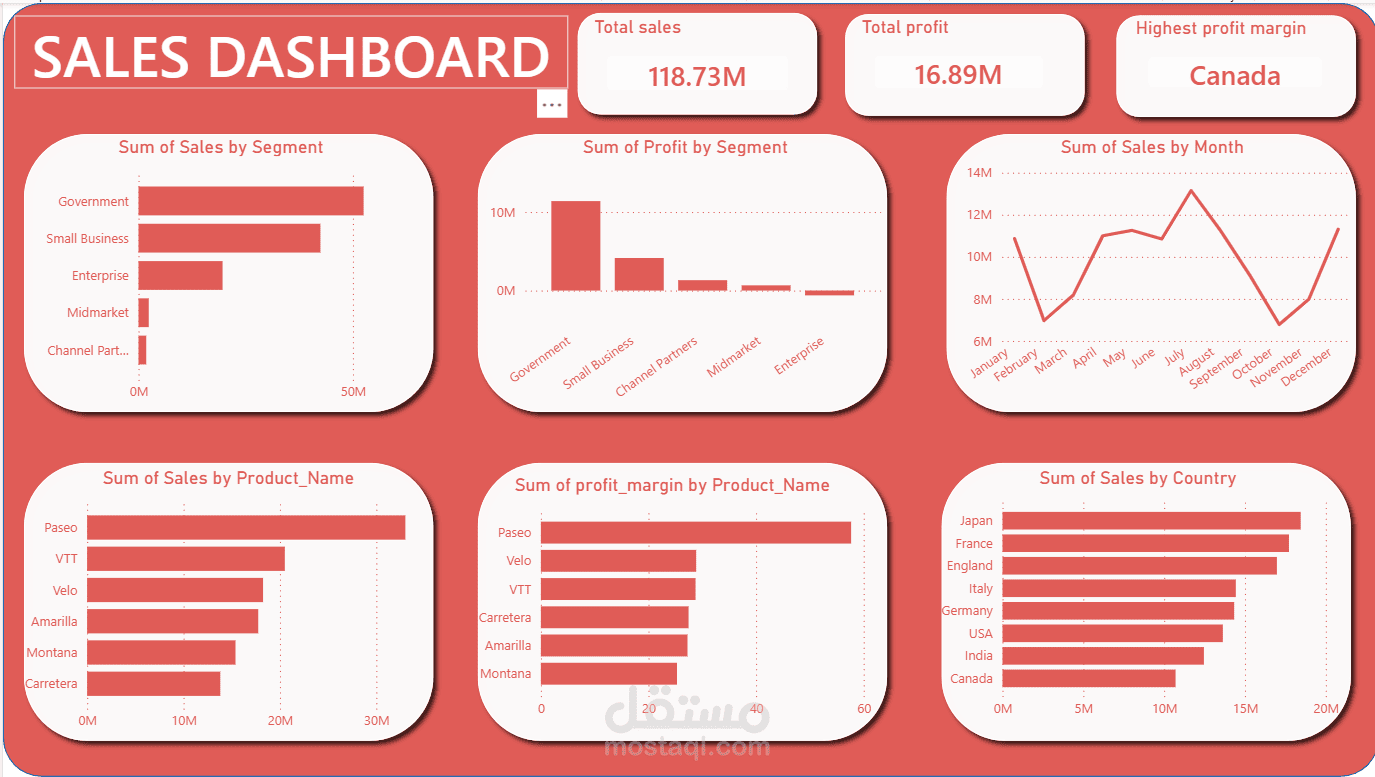
I designed this interactive Sales Dashboard in Power BI to provide a clear overview of business sales and profitability performance.
The dashboard highlights key KPIs such as Total Sales of 118.73M, Total Profit of 16.89M, and the country with the highest profit margin. It also analyzes performance across different business segments, products, countries, and months.
Key features include analysis of sales and profit by segment, monthly sales trends, top-performing products, profit margin by product, and sales performance by country.
This dashboard helps decision-makers quickly identify top-performing areas, compare business segments, monitor sales trends, and discover opportunities to improve profitability.
Tools & Skills: Power BI • Data Cleaning • Data Visualization • KPI Development • Dashboard Design • Business Analysis • Data Analysis