Interactive Data Dashboard & Pivot Analysis
تفاصيل العمل
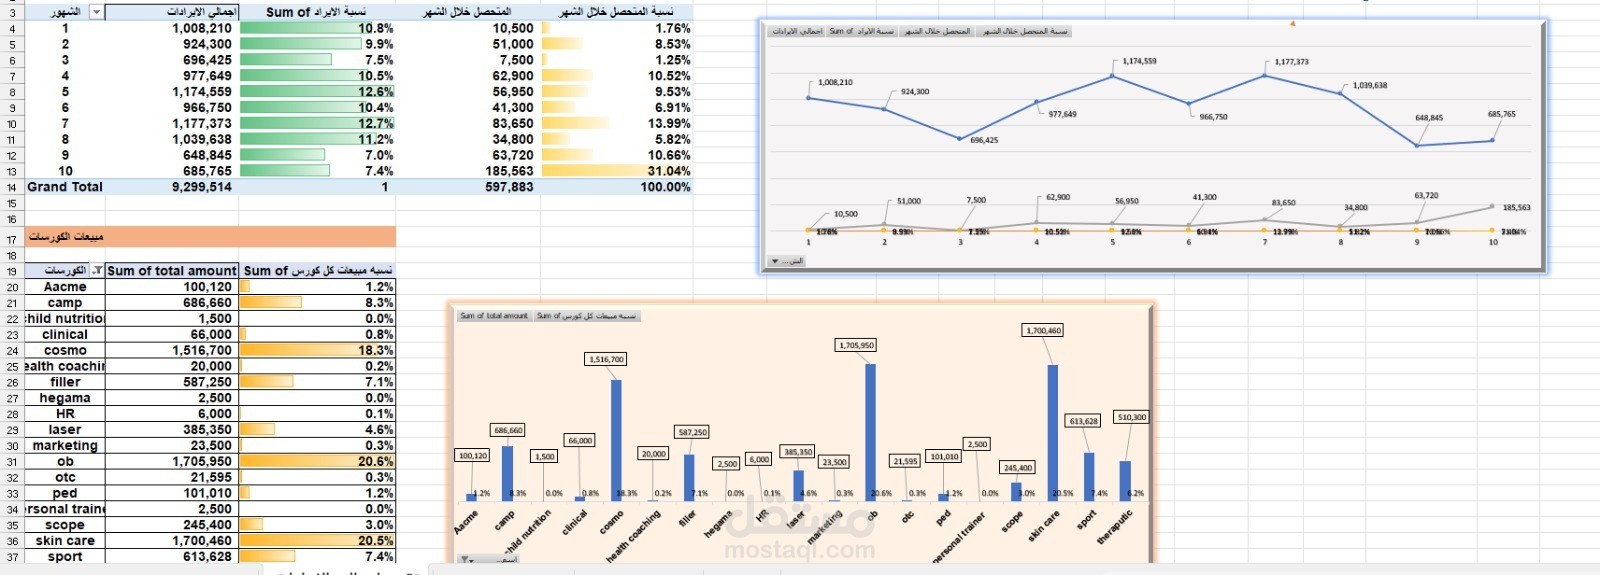
This project includes:
Data cleaning and organization
Pivot Tables for detailed analysis
Interactive charts and visualizations
Monthly or weekly performance summaries
Easy-to-understand insights for decision-making
The dashboard is designed to be user-friendly, professional, and ready to help you track trends, monitor KPIs, and make informed business decisions.