Production & Distribution Performance Dashboard | Power BI
تفاصيل العمل
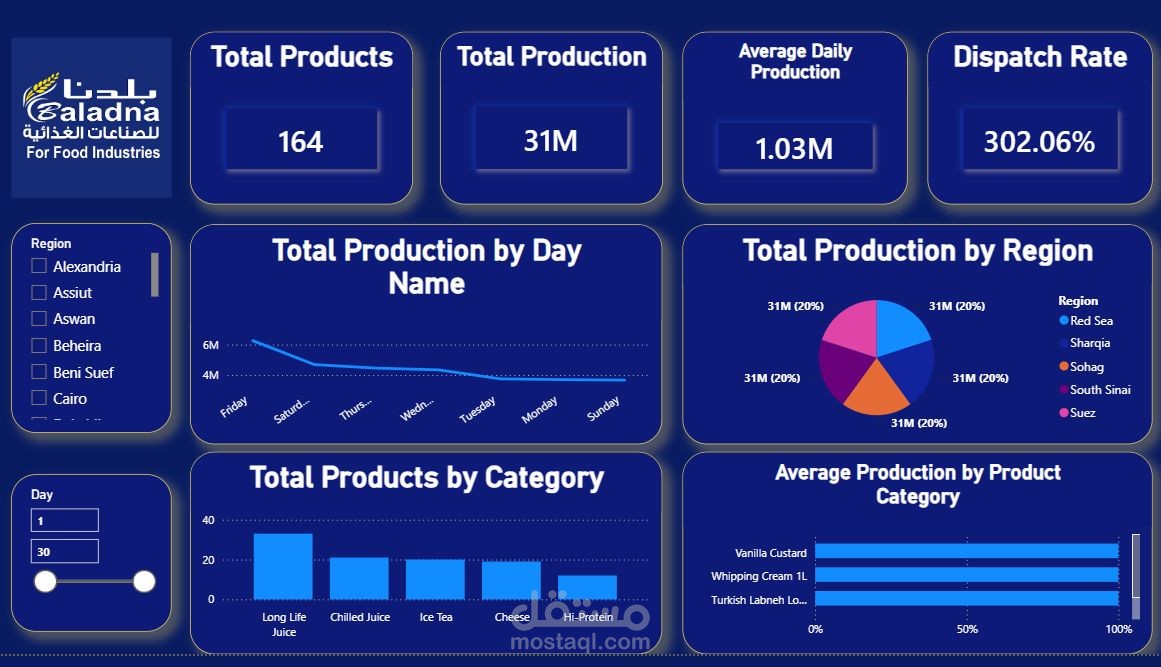
Excited to share a recent Power BI project I built for Baladna for Food Industries (بلدنا للمنتجات الغذائية) — an end-to-end dashboard tracking production and dispatch performance across regions and product categories.
What the dashboard covers:
📊 164 products tracked across multiple categories
📈 31M total production units with daily trend analysis
🗺️ Regional breakdown across 6+ governorates (Alexandria, Assiut, Aswan, Beheira, Beni Suef, Cairo, and more)
🎯 Dispatch rate vs. target tracking
📅 Interactive day/date-range filtering
Key insights surfaced:
Production trends by day of the week to spot operational patterns
Category-level performance (Long Life Juice, Chilled Juice, Ice Tea, Cheese, Hi-Protein)
Average production breakdown by product (Vanilla Custard, Whipping Cream, Turkish Labneh)
Even regional distribution across Red Sea, Sharqia, Sohag, South Sinai, and Suez
On the technical side:
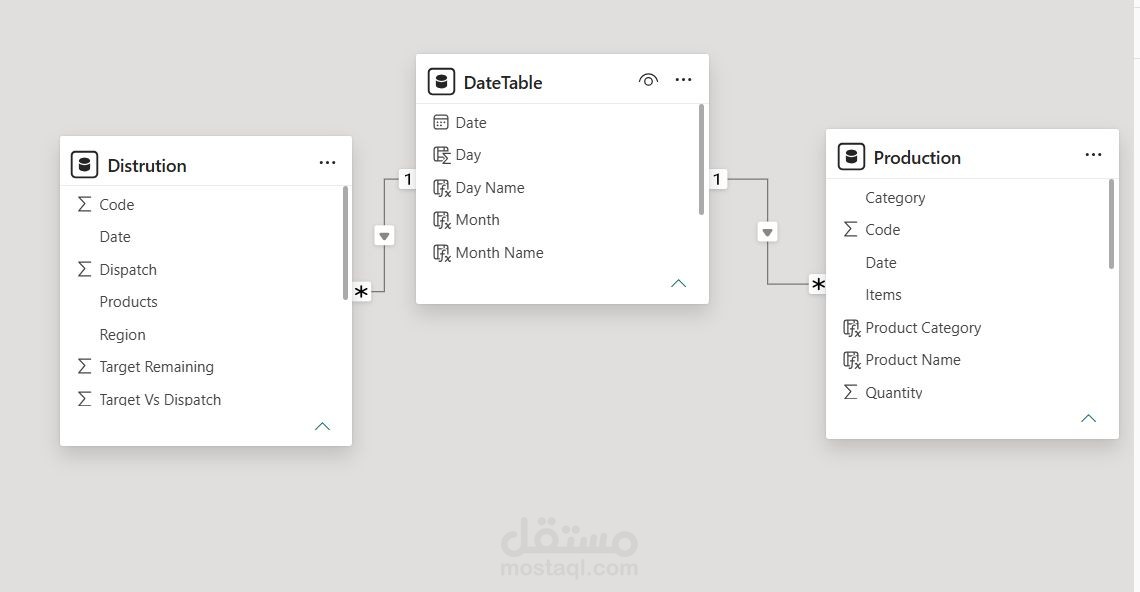
I built a proper star schema data model — a central Production fact table linked to a Distribution fact table and a dedicated DateTable (with Day, Day Name, Month, Month Name), enabling clean time intelligence and cross-filtering across all visuals.
Tools: Power BI | DAX | Power Query | Data Modeling
This project reinforced how important a clean, well-designed data model is before jumping into visuals — it makes everything downstream (measures, filtering, performance) so much smoother.