E-commerce summary
تفاصيل العمل
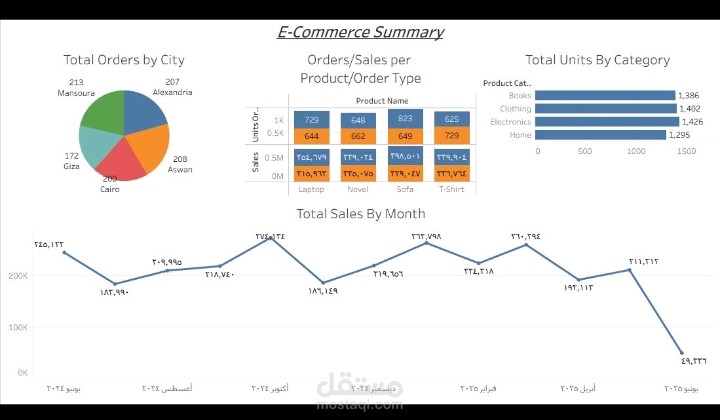
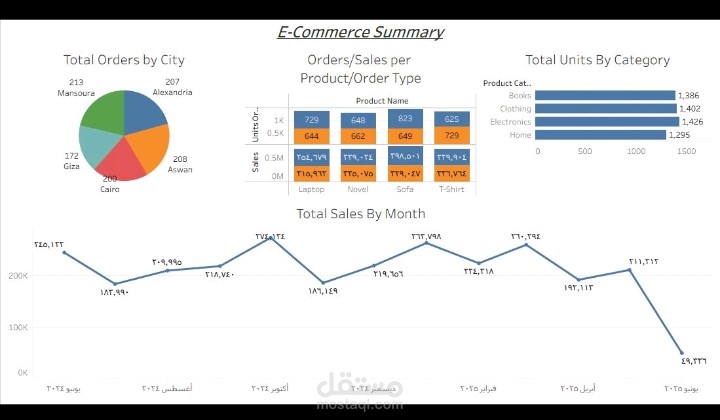
A dashboard that showing
a Demonstration project utilizing a randomized sales dataset covering specific products across several Egyptian governorates via e-commerce channels.
After using MySQL Workbench Query for cleaning and editing, We translated this into a visual dashboard in Tableau.
The dashboard explanations can be summarized as follows :
1/ Total orders for each city
2/ Total sold units for each category
3/ Total sales trend via months
4/ Total orders & Total sales based on Order type & Name of product