Retail Sales Analytics Dashboard
تفاصيل العمل
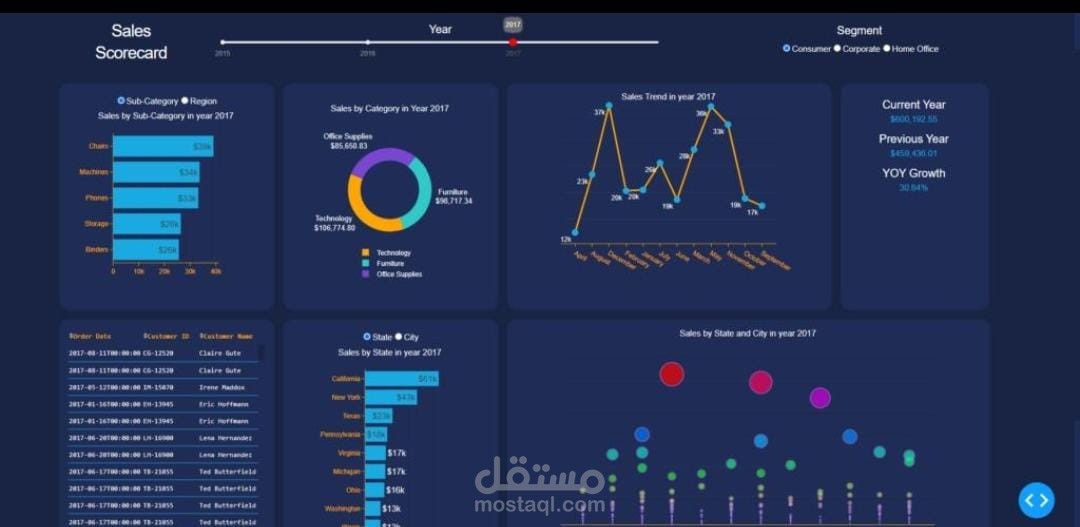
Developed an interactive dashboard for analyzing a retail sales dataset containing more than 12,000 records.
- Built an end-to-end data analytics pipeline.
- Cleaned, preprocessed, and validated data using Pandas and Pandera.
- Generated automated data profiling reports using Sweetviz before and after cleaning.
- Developed an interactive dashboard using Dash and Plotly.
- Visualized sales trends, category performance, and customer behavior.
- Structured the project using modern Python development tools including pyproject.toml and Ruff.
Technologies: Python, Pandas, NumPy, Pandera, Sweetviz, Plotly, Dash, Matplotlib, Data Analysis, Data Visualization