Healthcare & Hospital Performance
تفاصيل العمل
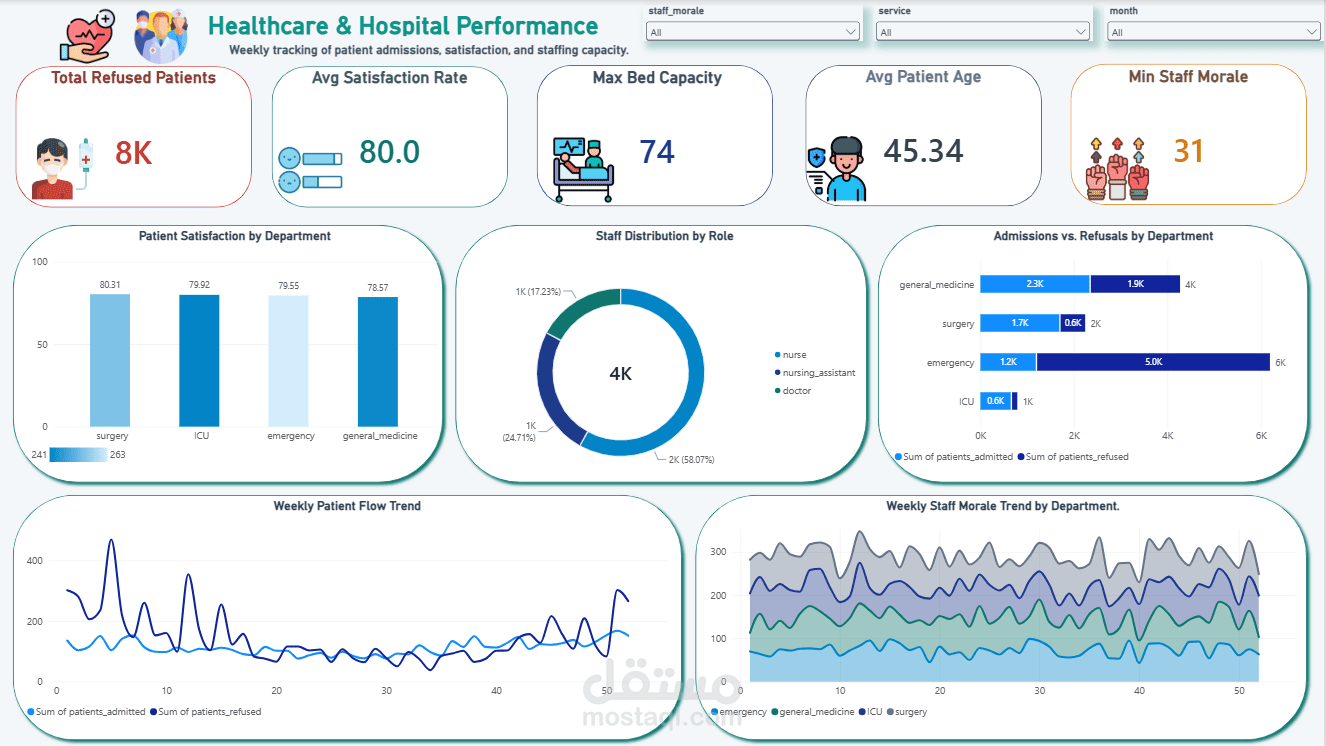
Optimizing hospital operations and improving patient care require actionable, data-driven insights. In this project, I designed an interactive end-to-end Power BI dashboard to track hospital performance, patient satisfaction, and workforce allocation.
🔍 Key Insights & Metrics Tracked:
Patient Care Quality: Tracked average satisfaction scores across multiple departments to identify high-performing units.
Capacity & Operations: Analyzed patient admission vs. refusal trends to pinpoint operational bottlenecks and optimize bed availability.
Workforce Performance: Monitored staff distribution and weekly team morale levels to ensure effective resource allocation and balance workloads.
🛠️ Tools & Concepts Used:
Data Modeling: Modeled multiple relational datasets (Patients, Services_Weekly, and Staff_Schedule) using clean data architecture principles.
DAX & Aggregations: Calculated key performance indicators (KPIs) for metrics such as refusal rates, capacity, and average ages.
UI/UX & Data Storytelling: Created a custom layout with a cohesive healthcare color palette, structured containers, and clean visual hierarchy for high scannability.