Superstore 2018 Orders Analytics Dashboard
تفاصيل العمل
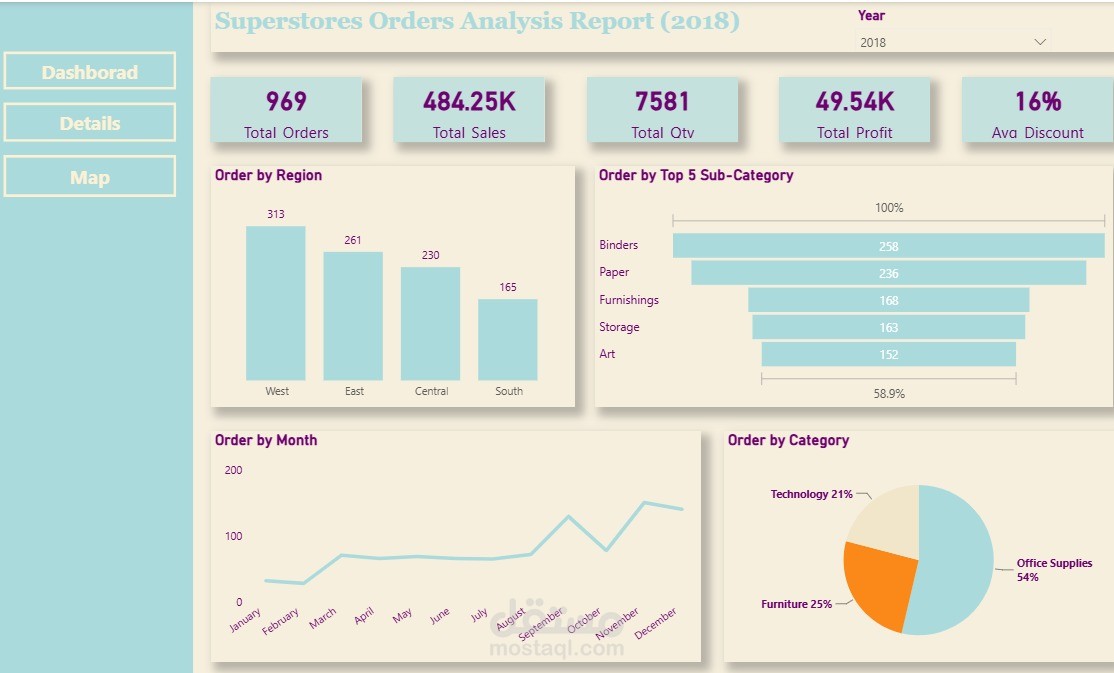
Designed and built an interactive Power BI dashboard analyzing 2018 Superstore orders and sales data across three pages: an Overview page with key KPIs (Total Orders, Total Sales, Quantity, Profit, Average Discount) and visuals by region, sub-category, month, and category; a Details page for granular data exploration; and a Map page visualizing order distribution by U.S. state. Used DAX for calculated metrics and interactive slicers for dynamic filtering.