Power BI Dashboard
تفاصيل العمل
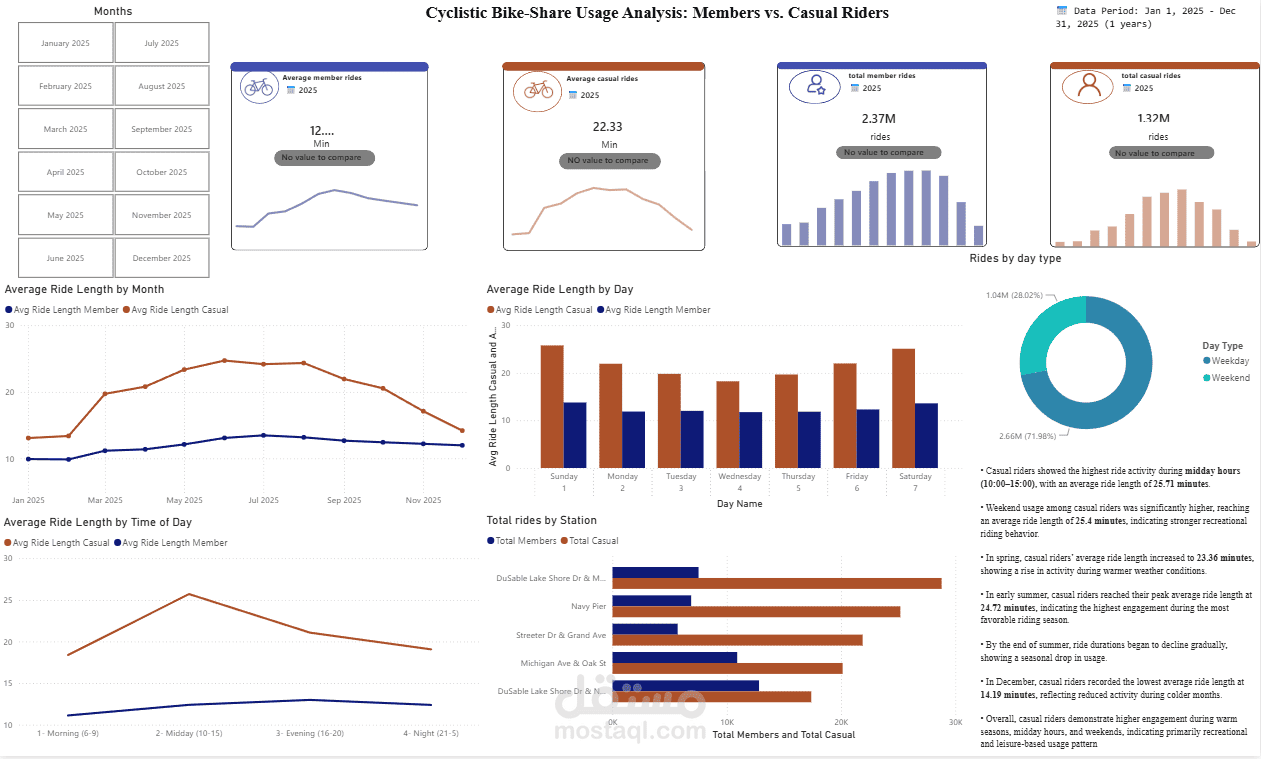
• Cleaned a public 5.5-million-row bike-share dataset down to 3.7 million records using Python and Power Query, then built an
interactive Power BI dashboard with DAX measures and KPI cards.
• Identified that casual riders take longer weekend/midday rides while members ride consistently on weekdays, an insight suited to
membership-conversion campaigns, and built a station-level ranking chart by rider volume.