dashboard
تفاصيل العمل
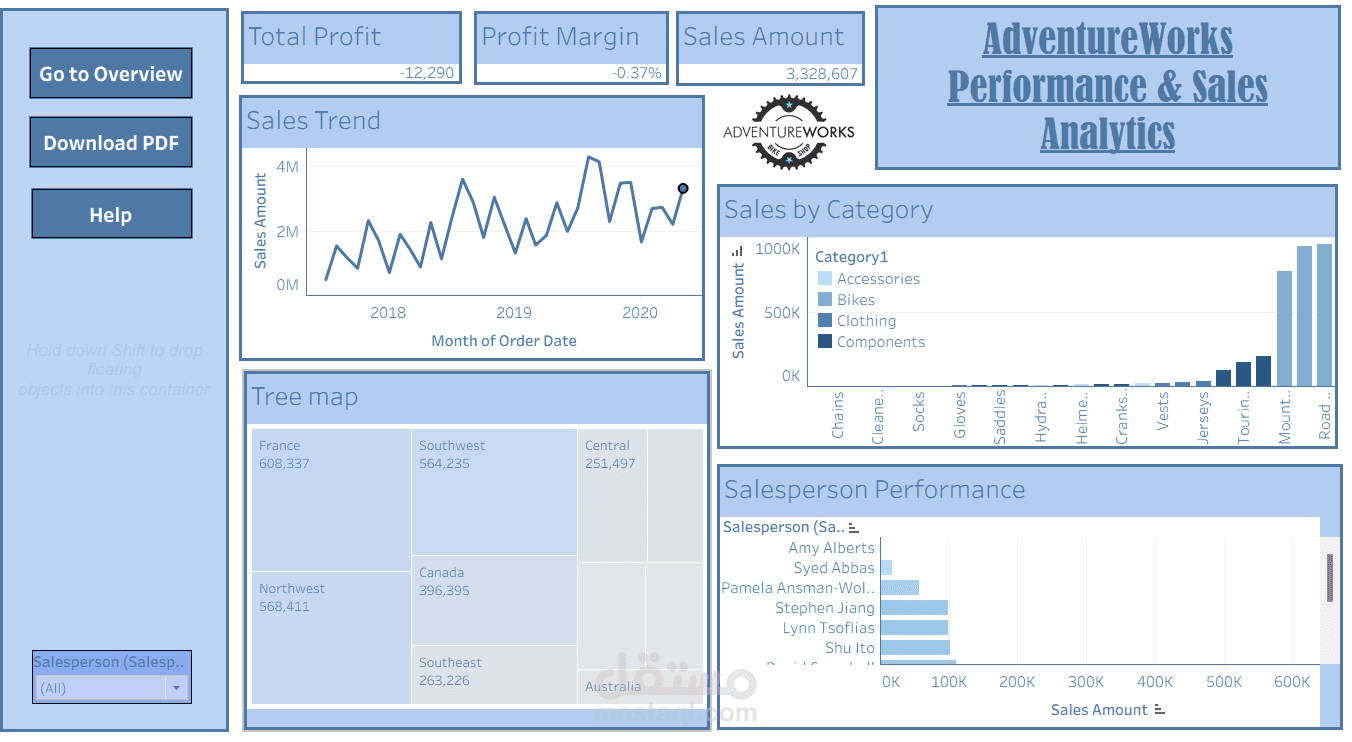
Complete Python code using Gradio and Plotly to replicate your second Tableau screen ("AdventureWorks Performance & Sales Analytics"), including the KPI top banner, time-series line chart, treemap, sub-category bar chart, and salesperson performance leaderboard.