Store performance Dashboard Power BI— NTI
تفاصيل العمل
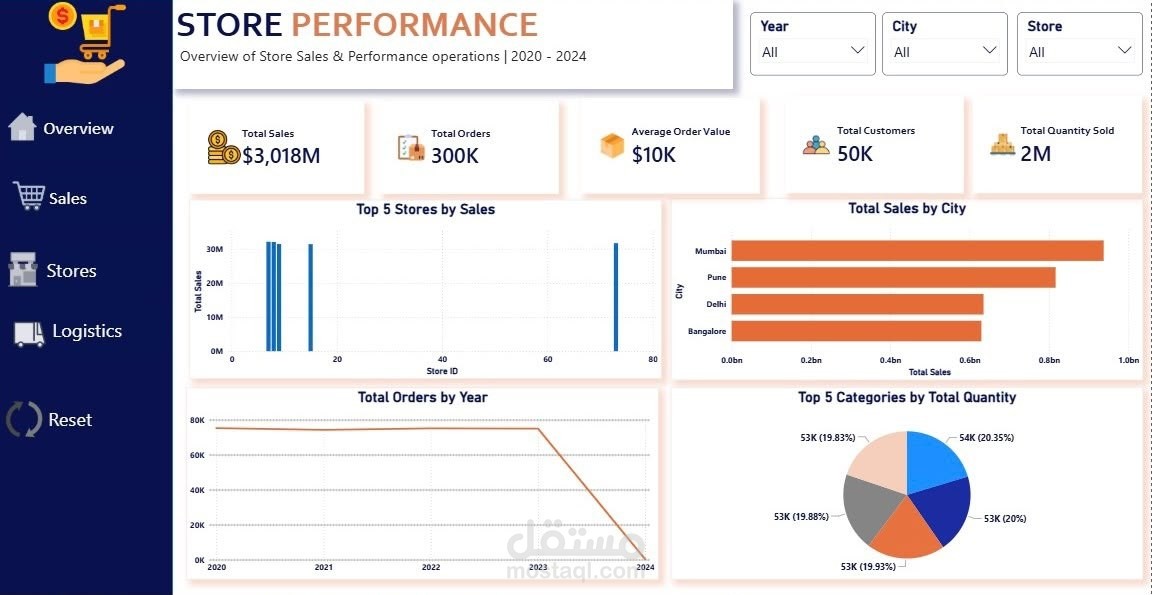
The dashboard provides an overview of store sales and performance through:
📌 Key Performance Indicators (KPIs)
Total Sales
Total Orders
Average Order Value
Total Customers
Total Quantity Sold
🏪 Top 5 Stores by Sales
Highlights the highest-performing stores and makes it easier to compare their sales performance.
📍 Total Sales by City
Compares sales across different cities and identifies the locations contributing the most to overall sales.
📈 Total Orders by Year
Shows the yearly trend in orders and helps identify changes i
🛍️ Top 5 Categories by Total Quantity