Data Jobs Power BI Dashboard
تفاصيل العمل
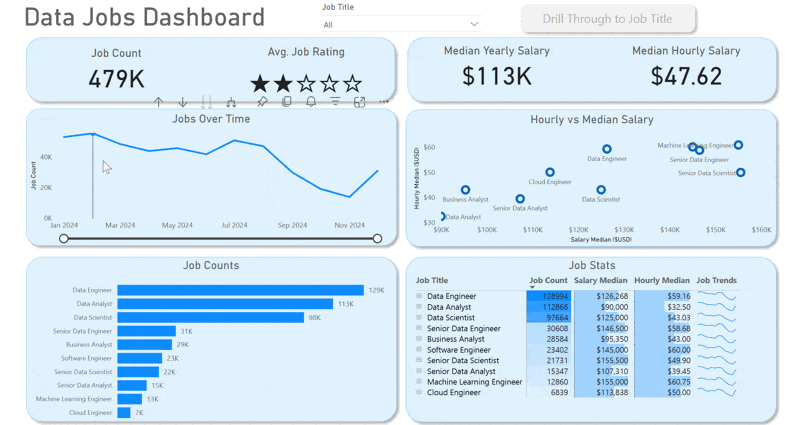
Interactive PowerBI dashboard analyzing job trends, salaries, and skills across data roles — built from 400k+ real job postings dataset.
This dashboard was created for Job Seekers, Job Transitioners, and Job Swappers to solve a common problem: information about the data job market is scattered and hard to grasp. Using a real-world dataset of 2024 data science job postings (including titles, salaries, and locations), this project provides a single, easy-to-use interface to explore market trends and compensation.
Skills Showcased
This project was a journey through key Power BI features. Here's a look at what we mastered:
⚙️ Data Transformation (ETL) with Power Query: Cleaned, shaped, and prepared the raw data for analysis by handling blanks, changing data types, and creating new columns.
🧮 Implicit Measures: Formulated measures to derive key insights and KPIs like Median Yearly Salary and Job Count.
📊 Core Charts: Utilized Column, Bar, Line, and Area Charts to compare job counts and track trends over time.
🗺️ Geospatial Analysis: Leveraged Map Charts to visualize the global distribution of jobs.
🔢 KPI Indicators & Tables: Used Cards to display key metrics and Tables to provide granular, sortable data.
🎨 Dashboard Design: Designed an intuitive and visually appealing layout, exploring both common and uncommon chart types to best tell the data story.
🖱️ Interactive Reporting:
Slicers: To dynamically filter the report by Job Title.
Buttons & Bookmarks: To create a seamless navigation experience.
Drill-Through: To navigate from a high-level summary to a contextual, detailed view.