Dashboard
تفاصيل العمل
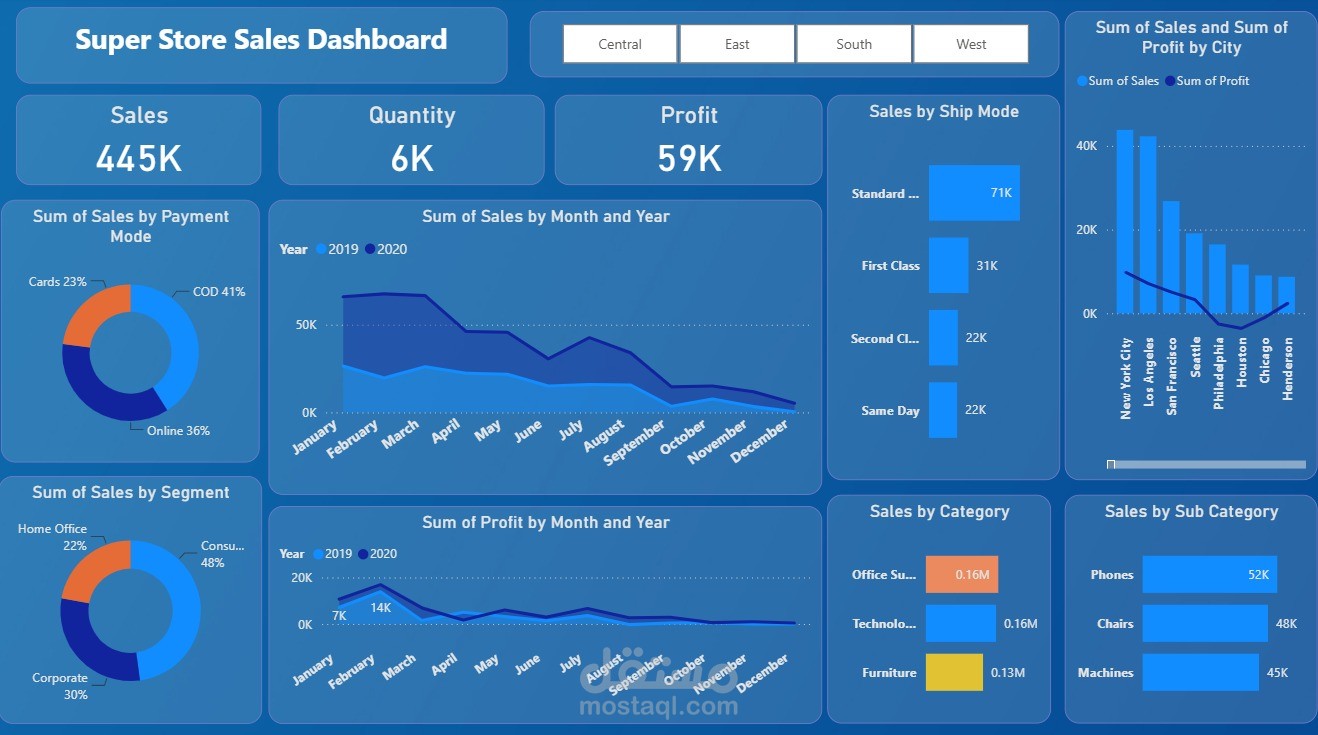
Superstore Sales Dashboard
“This project is based on the Superstore Sales dataset, which contains information about sales, profit, quantity, products, customers, regions, shipping methods, payment methods, and dates.
The main challenge was that the raw data contained a large amount of information, which made it difficult to quickly identify important business trends and performance indicators.
As a Data Analyst, I cleaned and prepared the data, analyzed the main KPIs, and explored sales and profit from different perspectives such as region, category, sub-category, customer segment, city, shipping mode, payment mode, and time.
Then, I built an interactive Power BI dashboard to transform the analysis into clear and useful visual insights.
The dashboard provides an overview of total sales, quantity, and profit, while also allowing users to compare regions, analyze trends over time, and identify the best-performing categories, sub-categories, cities, and customer segments.
The main benefit of the dashboard is that it transforms raw data into actionable insights and makes it easier for decision-makers to monitor performance and make data-driven decisions.”