Executive Sales & Returns Performance Dashboard
تفاصيل العمل
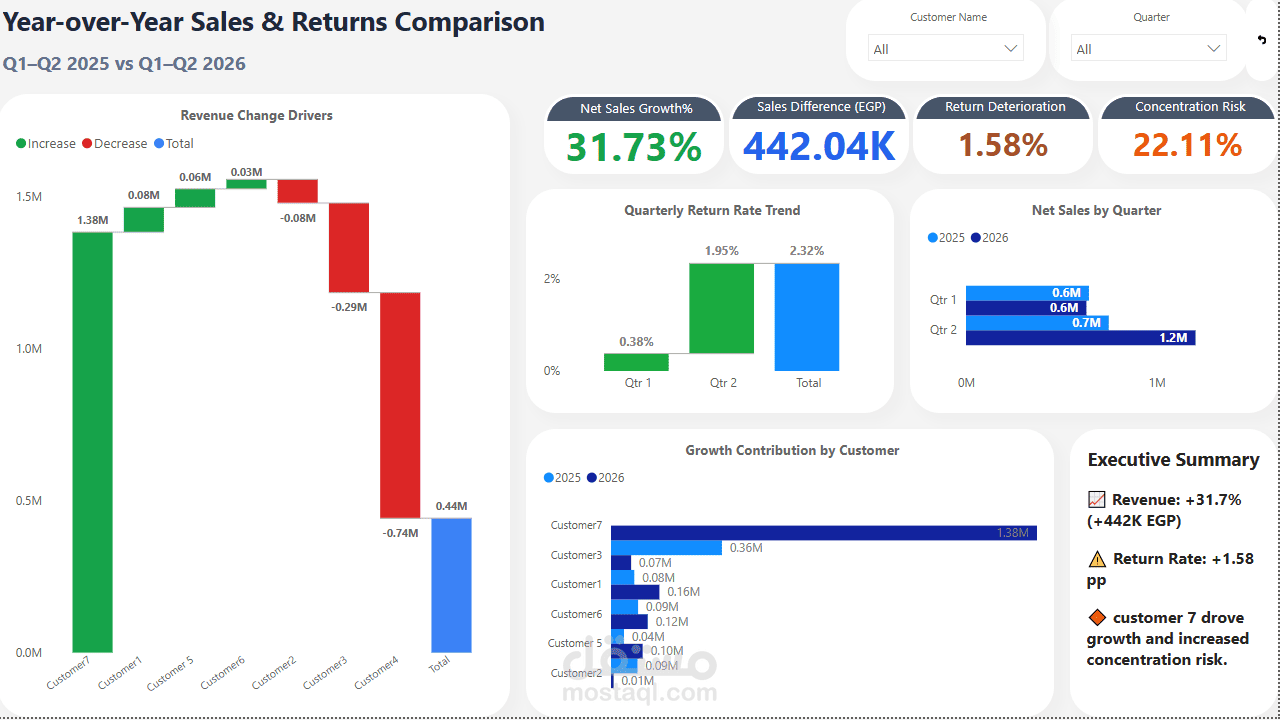
Excited to share my latest Power BI project: Executive Sales Performance Dashboard.
Over the past few weeks, I worked on building an interactive dashboard to analyze sales performance across FY2025 and FY2026. The goal wasn't just to create good-looking visuals, but to build a report that helps answer real business questions.
Some of the questions I focused on were:
Are sales growing?
Which customers contribute the most revenue?
Are returns increasing?
Which products generate the highest profit?
To build the report, I used Power BI, Power Query, DAX, and a Star Schema data model. I also cleaned and standardized customer names using Type 1 SCD logic to improve data quality before starting the analysis.
Some interesting findings from the project:
Net Sales increased by 31.7% in FY2026 (Jan–Jul) compared with the same period in FY2025.
MAF Hypermarket contributed 51.5% of FY2025 sales, increasing to 75.3% in FY2026, highlighting a strong dependency on a single customer.
The Return Rate increased from 0.34% to 2.30%, making it an area that deserves further investigation.
Price variance analysis also revealed pricing differences for the same products across different customers.
The biggest takeaway for me was that a dashboard is only as valuable as the quality of the data behind it. Clean data, a solid data model, and accurate calculations matter much more than adding more charts or visual effects.
I'd love to hear your thoughts or feedback!
hashtag