Sales Analysis Report
تفاصيل العمل
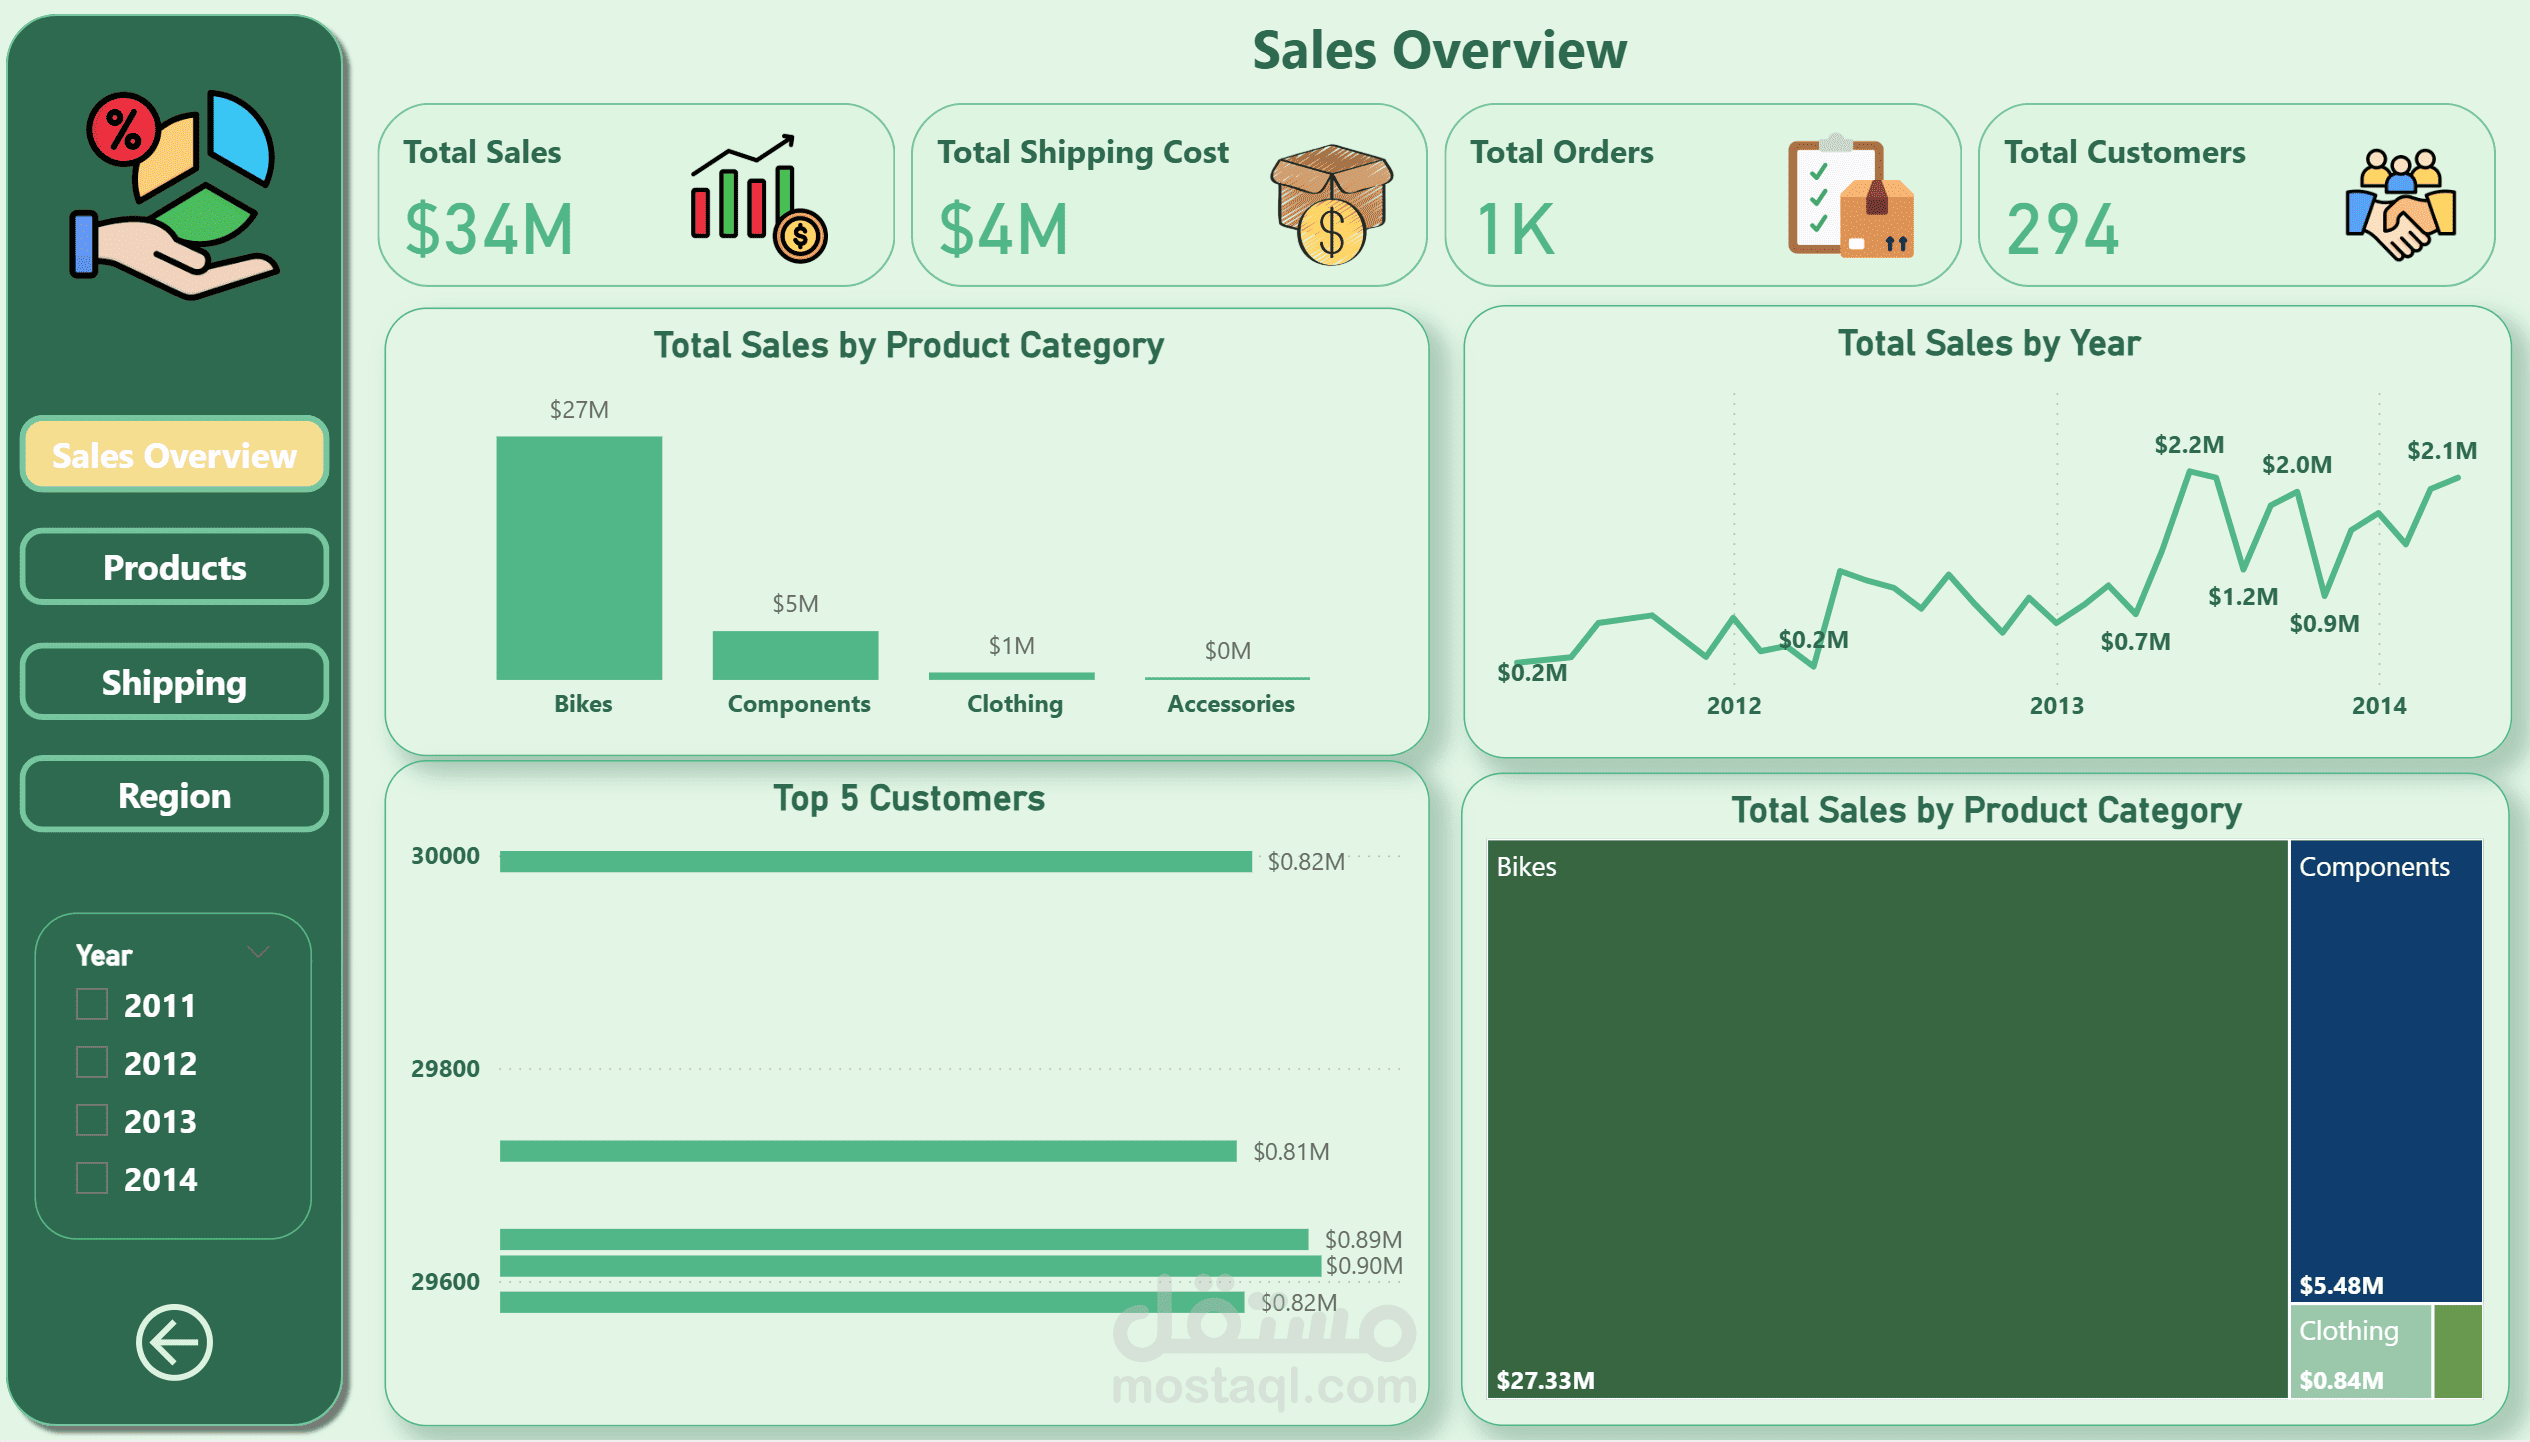
An interactive Power BI dashboard analyzing sales, shipping, product, and regional performance for a retail business using the AdventureWorks dataset, covering the period from 2011 to 2014. The dashboard transforms raw sales data into actionable business insights across four dynamic report pages.
Track overall sales performance, orders, and customer growth over time.
Analyze product and category performance to identify top-selling items.
Monitor shipping costs and order status to evaluate fulfillment efficiency.
Break down sales performance by region and territory.