Super Store Analysis
تفاصيل العمل
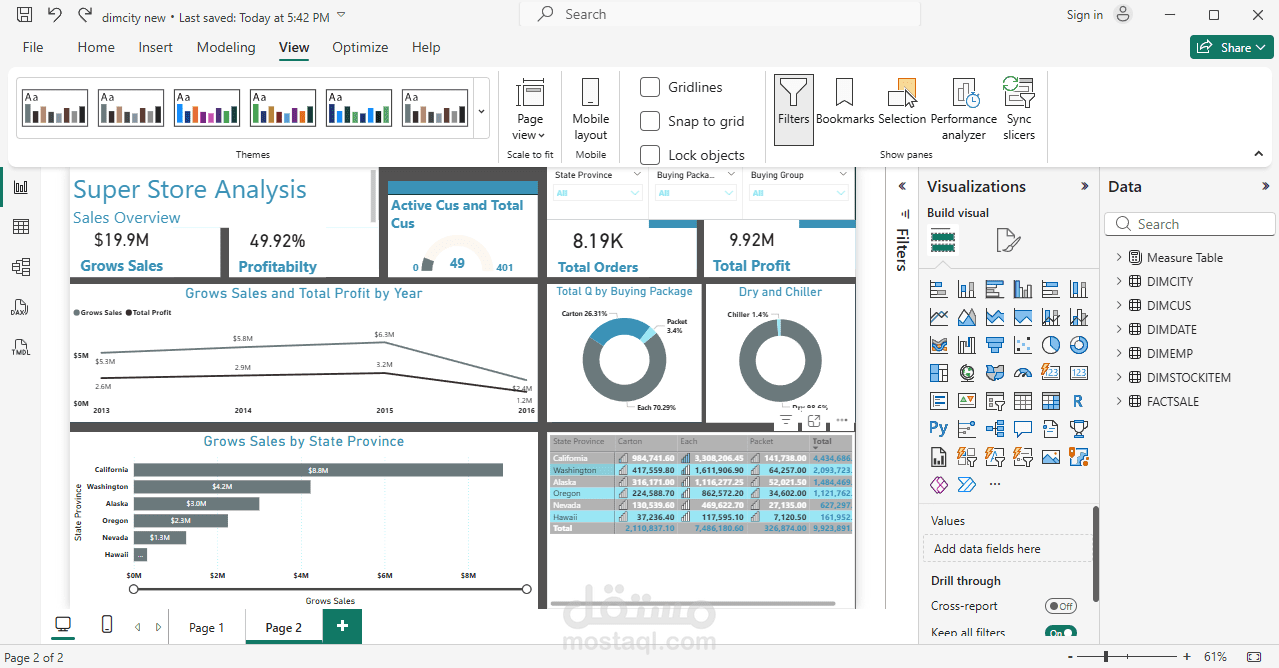
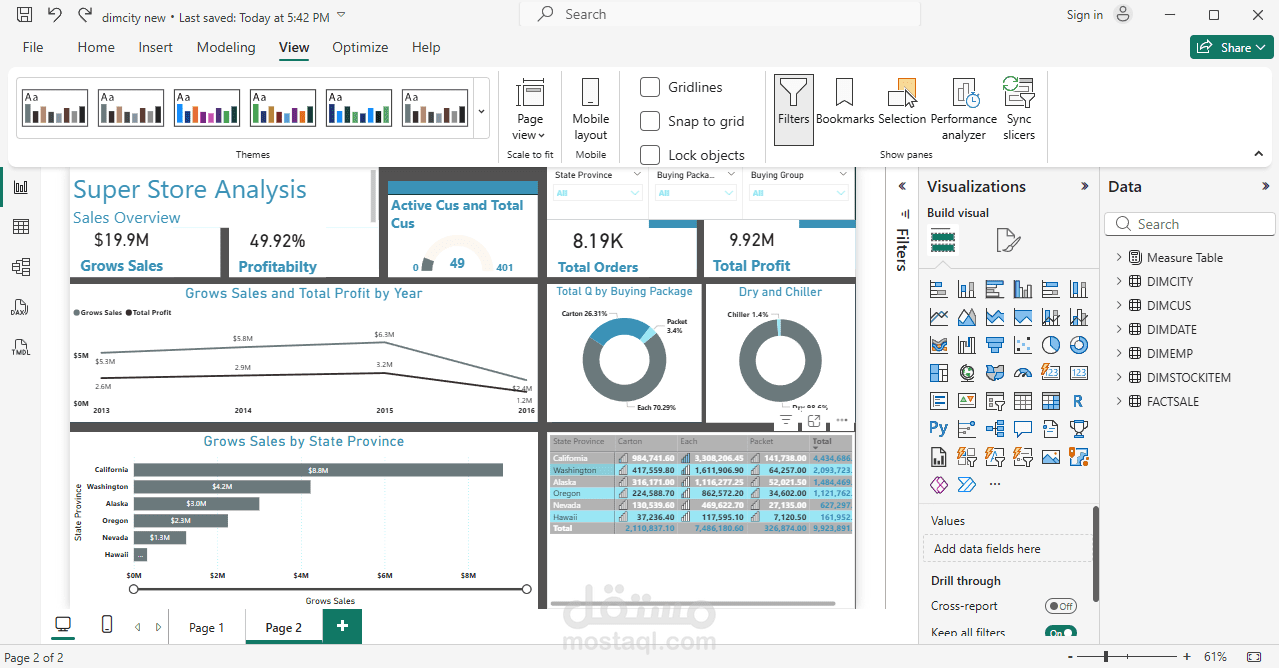
DimCity Sales Dashboard | Power BI Project
I’m excited to share my first Power BI project: DimCity Sales Dashboard 📊
In this project, I worked on analyzing sales data to extract meaningful insights and support data-driven decision-making. The dashboard provides a clear and interactive view of business performance across different dimensions.
🔍 Key Highlights:
Analyzed sales performance by product, region, and customer
Built interactive dashboards to track total sales, quantity sold, and revenue trends
Created dynamic visualizations to identify top-performing products and regions
Used filters and slicers to allow easy exploration of the data
Applied data cleaning and transformation techniques using Power Query
📈 Tools & Skills Used:
Power BI (Data Modeling & Visualization)
Data Cleaning & Transformation
DAX (for calculated measures)
Business Analysis & Insights Generation
💡 This project helped me strengthen my skills in data analysis and visualization, and it’s a great step in my journey toward becoming a Data Analyst.