ShopEasy Marketing Analytics Dashboard
تفاصيل العمل
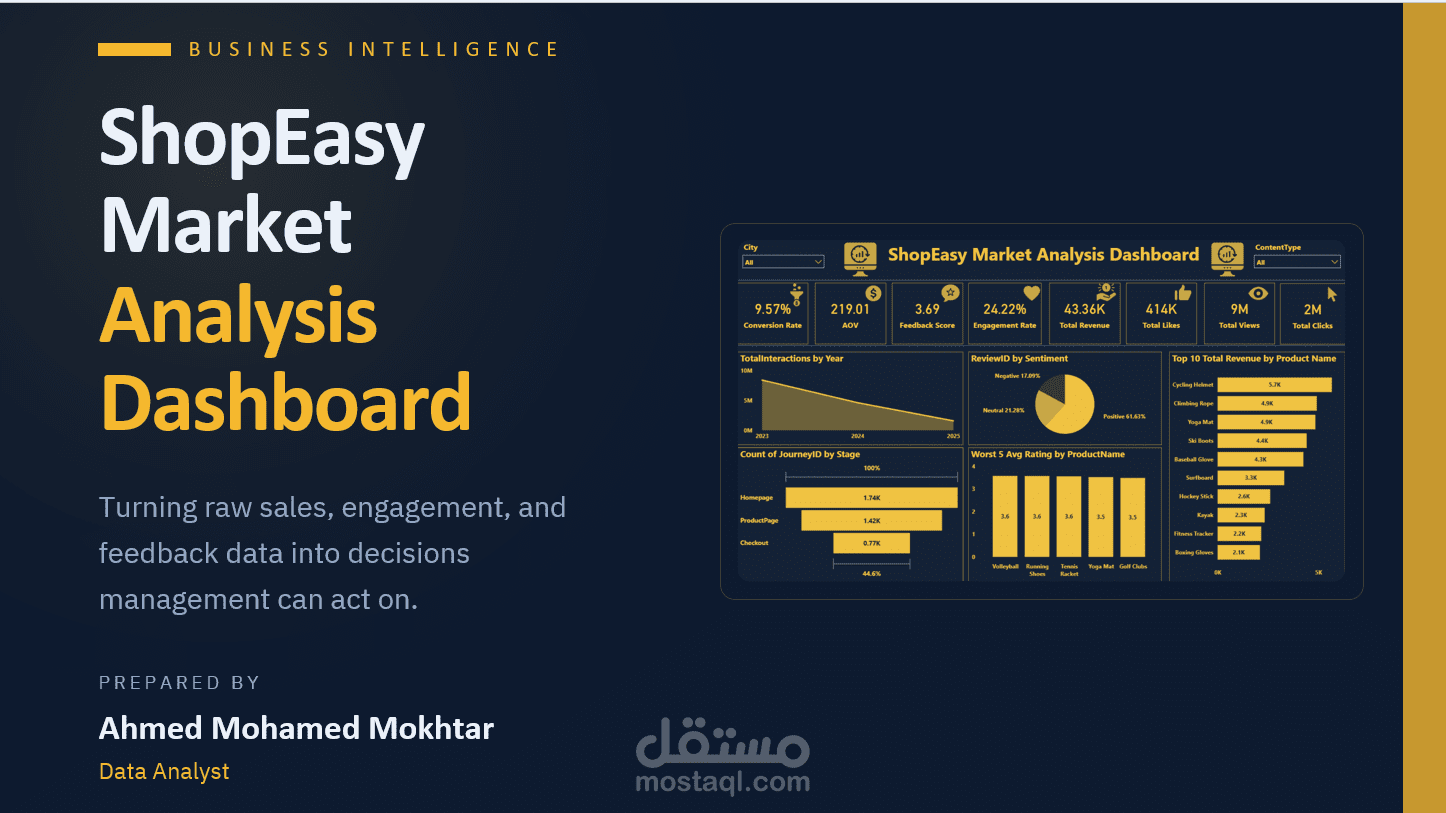
*ShopEasy Market Analysis: Turning Raw Data into Actionable Insights*
I recently completed an end-to-end data analytics project for ShopEasy, covering the full pipeline from SQL Server data cleaning to an interactive Power BI dashboard.
*📊 Key Metrics Uncovered:*
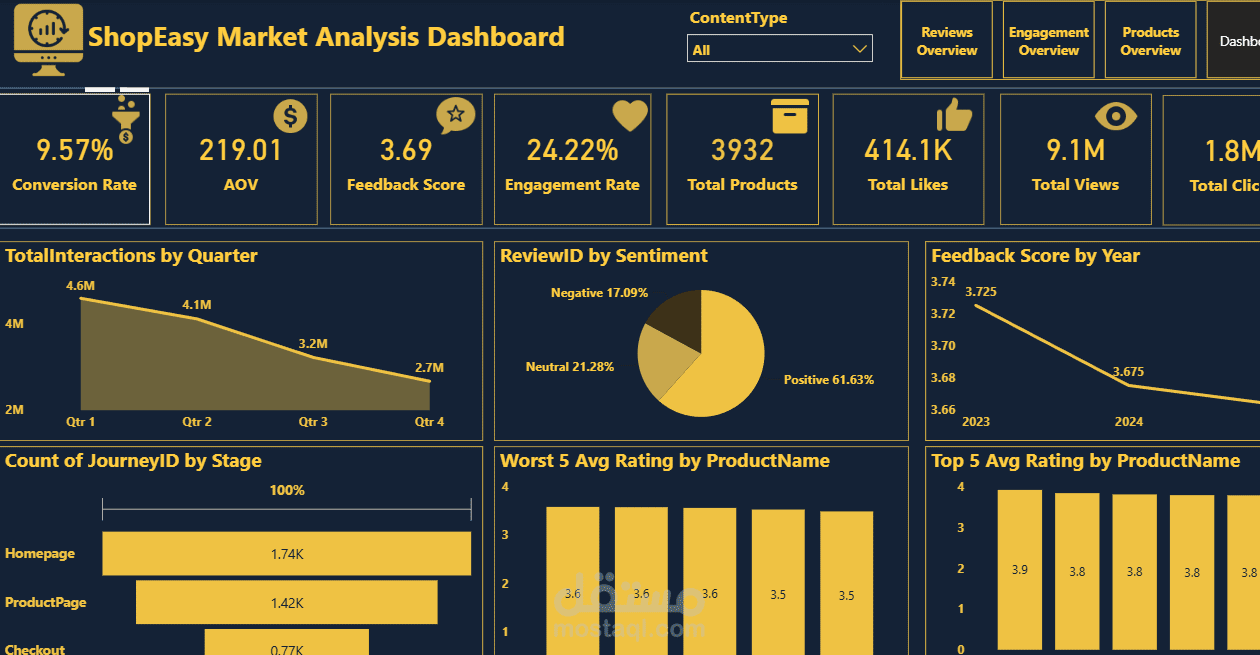
🔹 9.57% Conversion Rate
🔹 $219.01 Average Order Value
🔹 3.69 Customer Feedback Score
🔹 24.22% Engagement Rate
🔹 9.1M Total Views | 1.8M Total Clicks
*🔍 What the Data Revealed:*
The dashboard surfaced some critical trends — customer engagement dropped sharply over the year (from 4.6M to 2.7M interactions per quarter), the checkout stage showed a significant drop-off compared to homepage and product page visits, and feedback scores declined steadily from 3.73 to 3.66 year over year.
*💡 Turning Insights into Action:*
Based on these findings, I put together clear, data-backed recommendations:
✅ Launch targeted re-engagement campaigns
✅ Simplify and optimize the checkout flow
✅ Improve quality on consistently low-rated products
✅ Act on customer feedback to reverse the yearly decline
This project reinforced how powerful it is to pair clean, validated data with clear storytelling — a dashboard is only as good as the decisions it drives.
🛠️ Tools used: SQL Server | Power BI | DAX