Imployee-Data cleaning-powerbi -dashboard
تفاصيل العمل
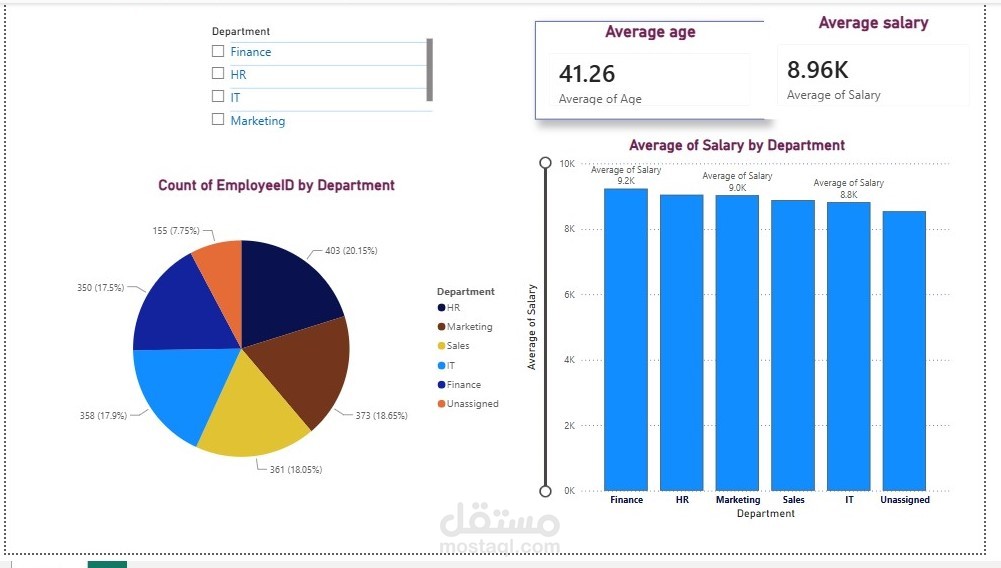
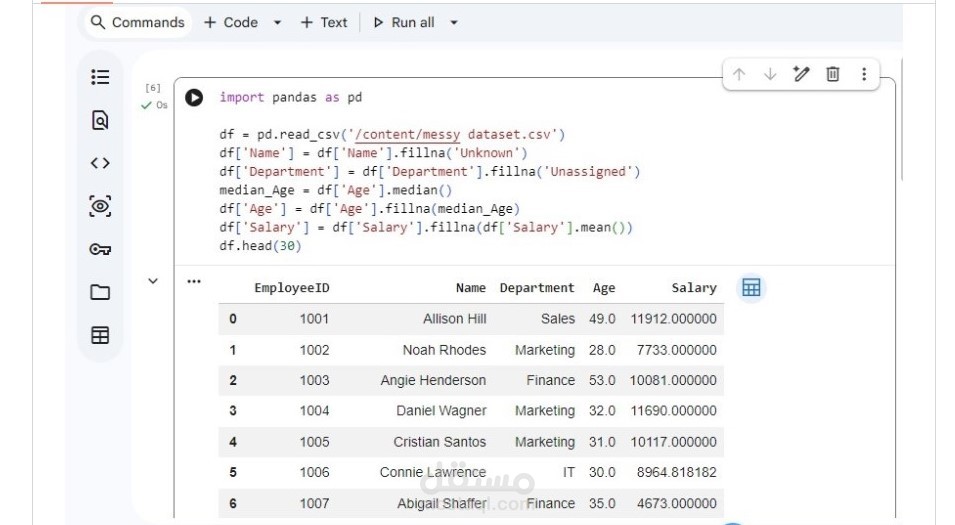
Employee Data Cleaning & Analytics Project 📌 Project Overview This project focuses on handling and cleaning an employee dataset with significant missing values and structural issues using Python. Following the data preparation phase, an interactive and professional dashboard was developed using Power BI to deliver actionable insights into the workforce structure and salary distribution. 🛠️ Methodology & Steps Phase 1: Data Cleaning & Exploration (Python / Pandas) Missing data was statistically evaluated to determine the mechanism of missingness and apply the appropriate imputation techniques: Name Column: Imputed missing values with 'Unknown' as the missingness mechanism was identified as MNAR (Missing Not At Random). Department Column: Imputed missing values with 'Unassigned' as the missingness mechanism was identified as MNAR. Age Column: Imputed missing values using the Median since the missingness mechanism was MCAR (Missing Completely At Random). Salary Column: Conducted an Outliers Test which confirmed the absence of any extreme anomalies. Since the data was normally distributed without outliers and the missingness was MCAR, missing values were imputed using the Mean. Descriptive Statistics: Generated a comprehensive statistical summary for both Age and Salary columns to analyze distributions and standard deviations.
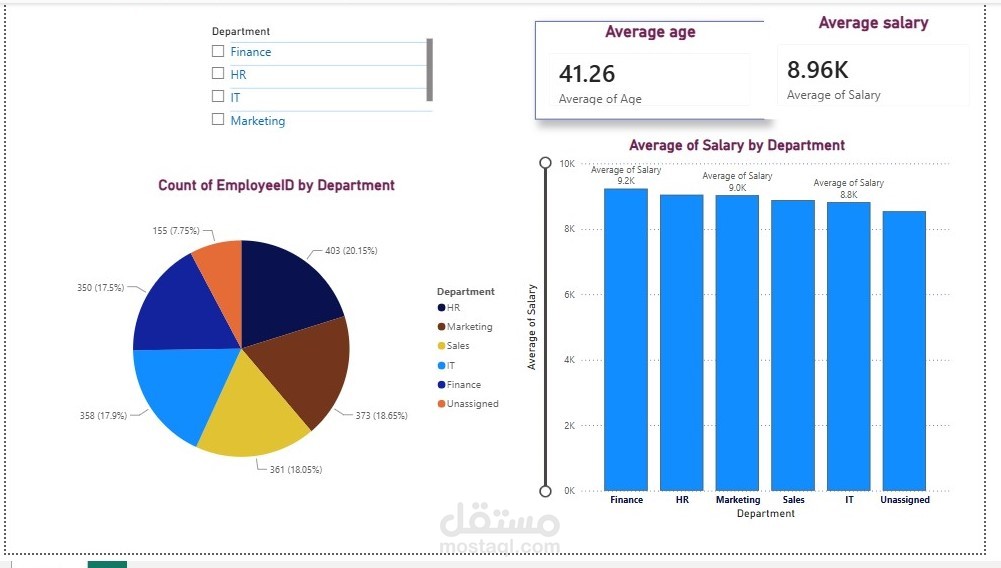
Phase 2: Data Visualization & Dashboarding (Power BI) The cleaned dataset was imported into Power BI to build an interactive dashboard tracking key workforce metrics: Average Age: A KPI card displaying the overall age demographic of the workforce. Average Salary: A KPI card providing a snapshot of the general compensation rate. Average of Salary by Department: A visual chart comparing budget allocation and compensation across different business units. Count of Employee by Department: A chart illustrating headcount distribution and workforce density within each department. 🚀 Tech Stack Python (Pandas Library) Google Colab Power BI Desktop