Healthcare_Claims_Cost_Analysis
تفاصيل العمل
Healthcare Claims & Cost Analysis Dashboard
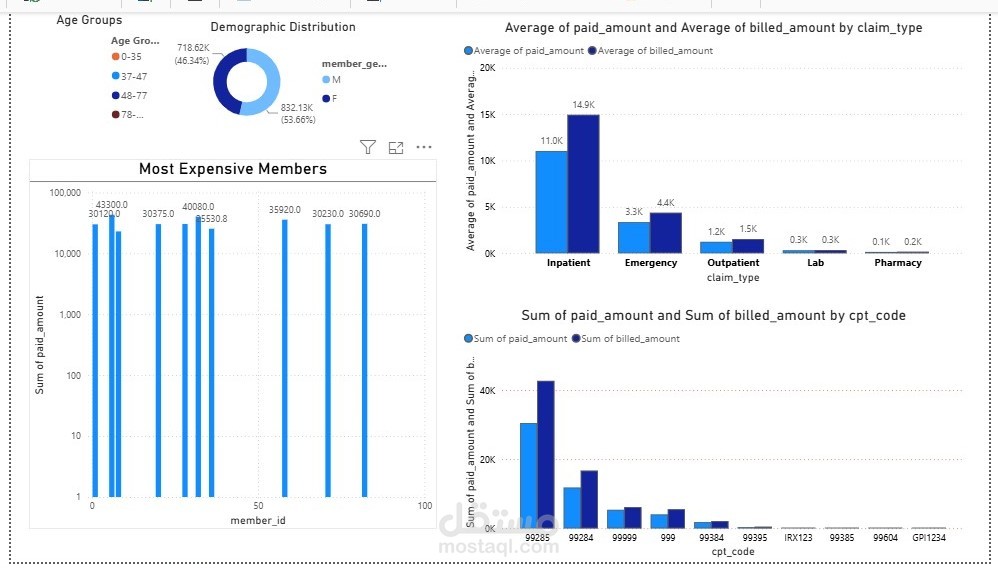
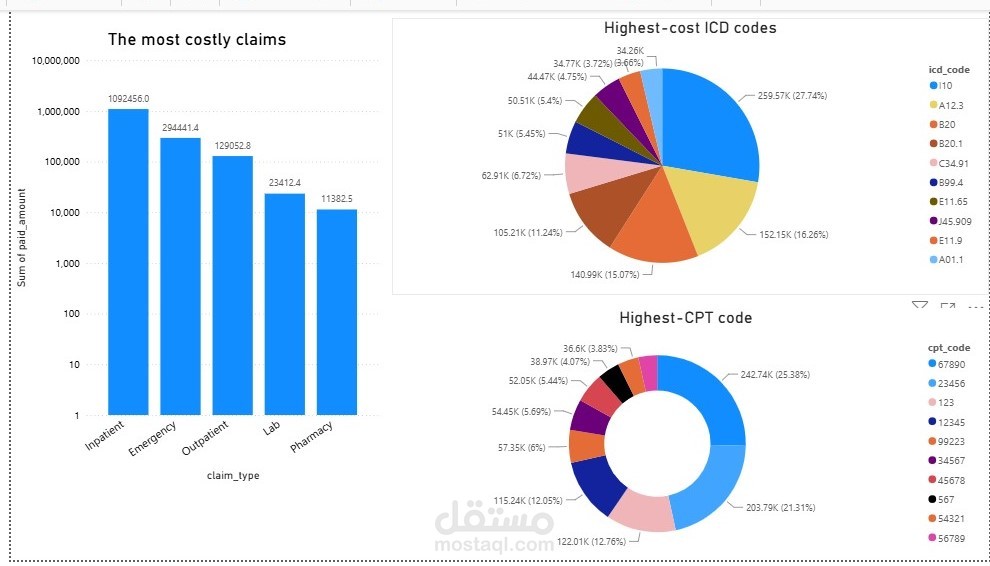
📊 Project Overview This Power BI dashboard provides a comprehensive financial and demographic analysis of medical insurance claims. It is designed to help insurance executives and financial officers monitor claims costs, evaluate medical necessity, and identify key areas of financial savings.
#Key Business Questions Answered
Most Expensive Claim Types: Identified which service categories (Inpatient, Outpatient, ER) consume the largest portion of the budget.
Top Diagnoses (ICD Codes): Filtered and ranked the top 10 medical conditions driving the highest total expenditure (Paid Amount).
High-Cost Members: Tracked cost concentration among members and segmented demographics by gender and custom age groups.
Financial Performance (Paid Ratio & Savings): Compared Billed Amount vs Paid Amount to measure institutional contract efficiency and detect high-margin billing discrepancies.
Data Model & Tech Stack
Tools: Power BI Desktop, DAX (Data Analysis Expressions).