Sales _Performance _PowerBI
تفاصيل العمل
#Sales & Customer Demographics Performance Dashboard
Tool used: Power BI | Power Query | DAX
Project Overview:
Developed an interactive and dynamic Power BI dashboard to analyze sales performance, evaluate regional market value, and understand customer purchasing behavior to support data-driven decision-making.
Key Features & Insights:
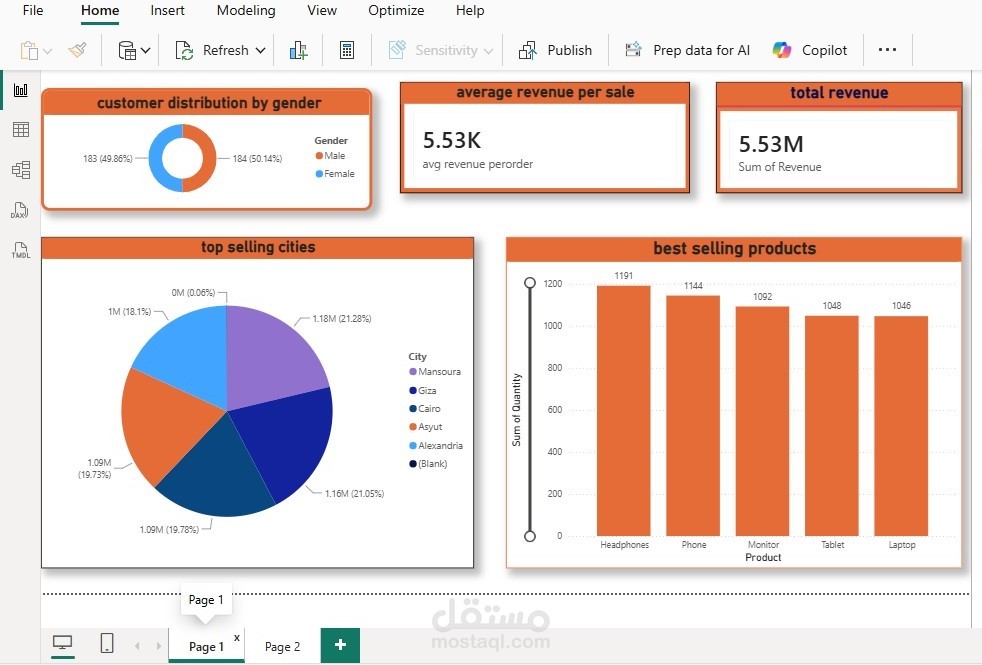
Financial Metrics: Analyzed total revenue and tracked the average revenue per transaction to evaluate sales efficiency.
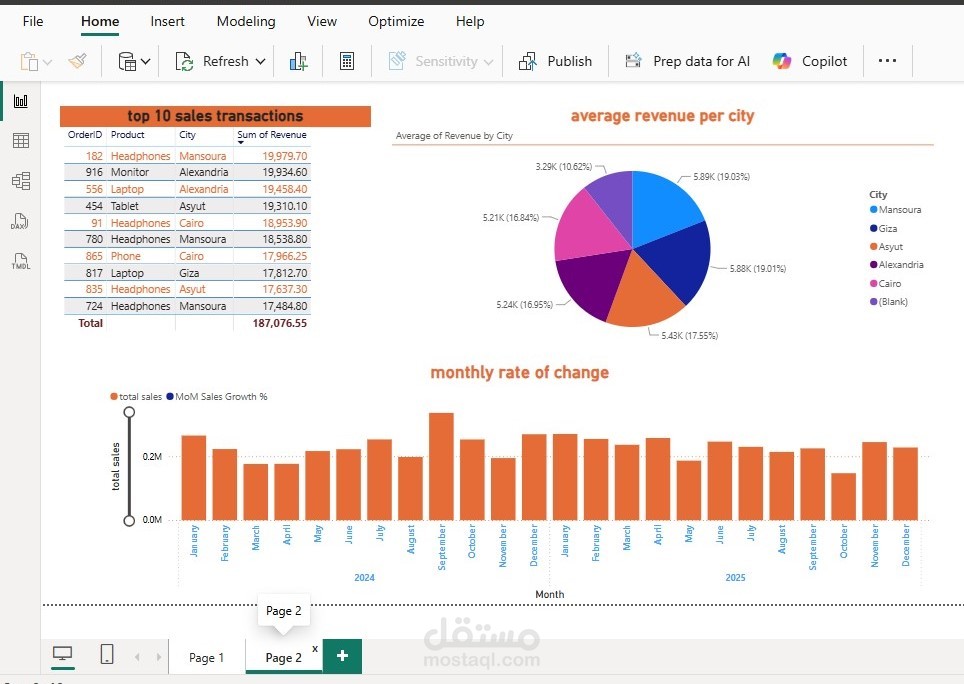
Time-Series Analysis: Formulated custom DAX expressions to calculate the Month-over-Month (MoM) growth rate, identifying seasonal sales trends.
Geographical Analysis: Segmented data to discover the top-performing cities by sales volume and compared them against the average revenue per city to detect high-value regional markets.
Product Performance: Identified the best-selling products to help optimize inventory management.
Customer Segmentation: Visualized customer distribution by gender to assist the marketing team in tailoring targeted campaigns.
High-Value Transactions: Isolated and highlighted the top 10 major transactions to identify key accounts and high-spending customers.