CFO DAshboard
تفاصيل العمل
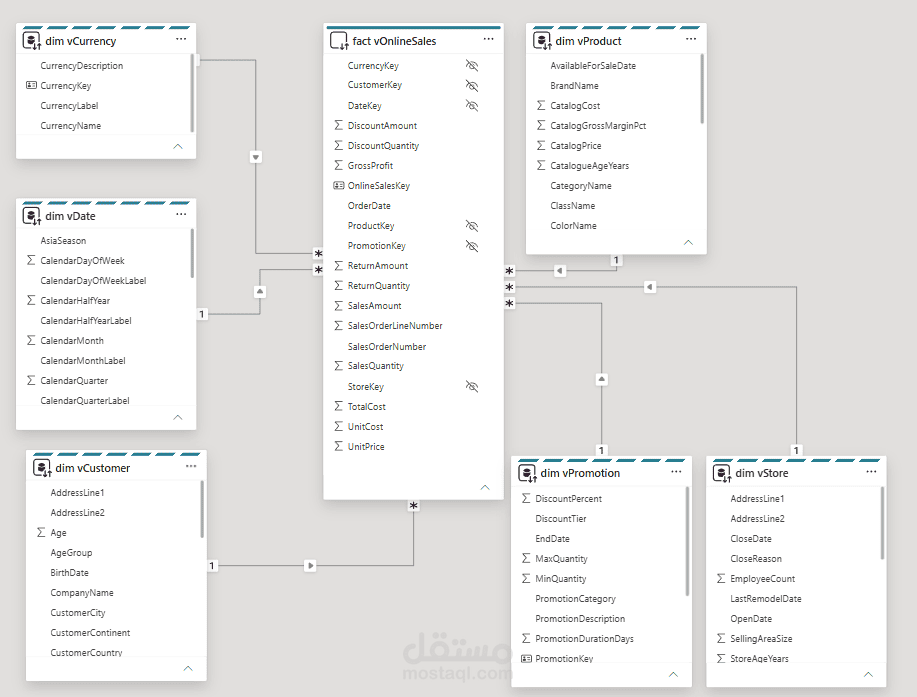
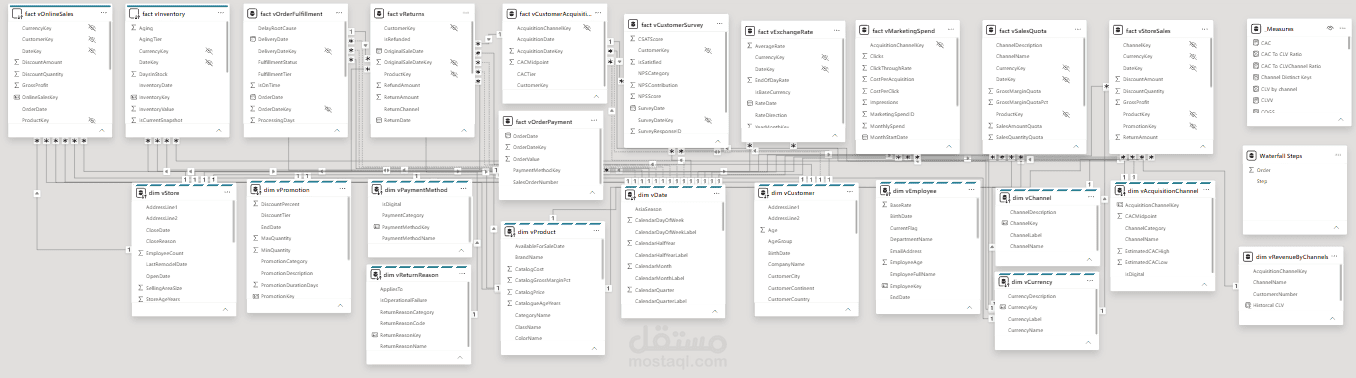
Analysis of a large scale retail dataset (30M rows, 11 fact tables, 12 dimension tables)
built to deliver insights across executive stakeholders using Power BI and SQL Server.
Period: 2023 to 2025
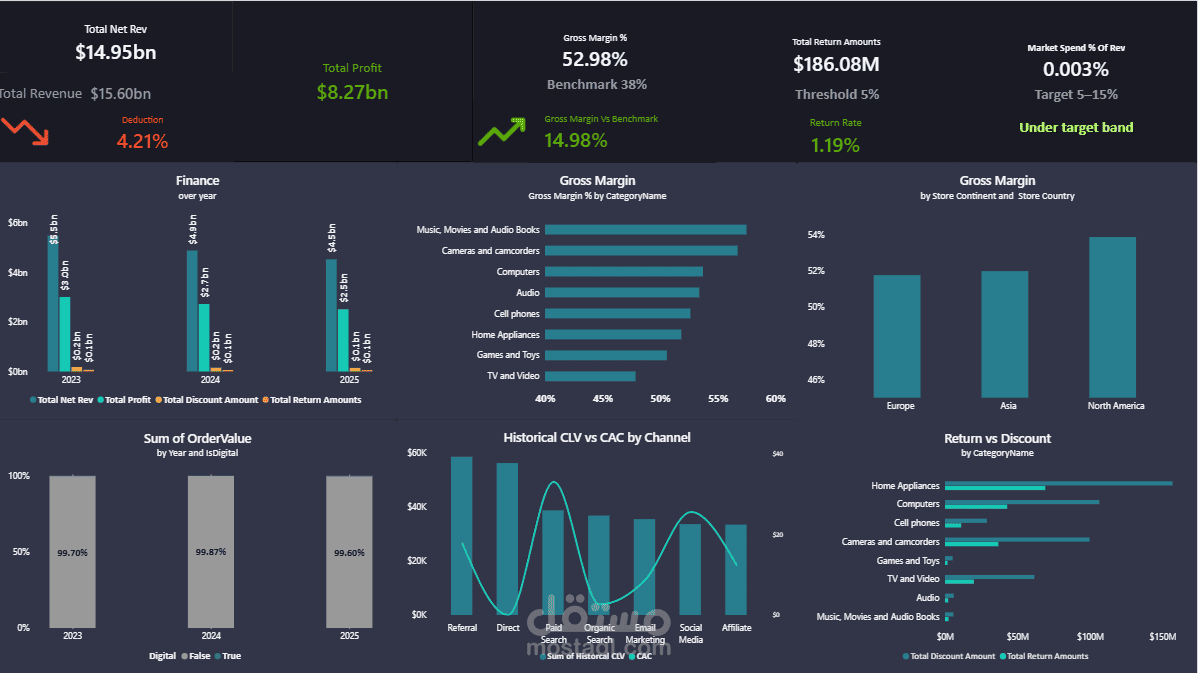
Dashboard 1 CFO: (it answers)
1- What is our revenue after discounts and returns, and what is our total profit?
2- What is marketing spend as % of revenue?
3- What is our gross margin by product category and geography?
4- What is payment method mix and digital adoption trend?
5- What is the CAC vs CLV payback channel?
6- What is the return vs discount relationship by category?