Intelligent-Multimodal-System-for-Cardiovascular-Disease-MediScope
تفاصيل العمل

MediScope — Intelligent Multimodal System for Cardiovascular Disease Assessment
MediScope is an end-to-end computer vision + machine learning pipeline that analyzes echocardiogram (heart ultrasound) videos to automatically segment the left ventricle, track its motion across the cardiac cycle, and estimate Ejection Fraction (EF) — the key clinical metric used to diagnose heart failure and other cardiovascular conditions.
It combines deep learning video segmentation (YOLOv8) with classical ML regression to go from raw ultrasound video straight to a quantitative cardiac function score and a clinical risk category, on the full ~10,000-video EchoNet-Dynamic dataset.
How it works
1. Data preparation — Loads EchoNet-Dynamic (10,030 echocardiogram videos + expert volume tracings), converts frame-level left-ventricle annotations into YOLO polygon labels, and splits into train/val/test (14,034 / 3,006 / 3,008 labeled frames).
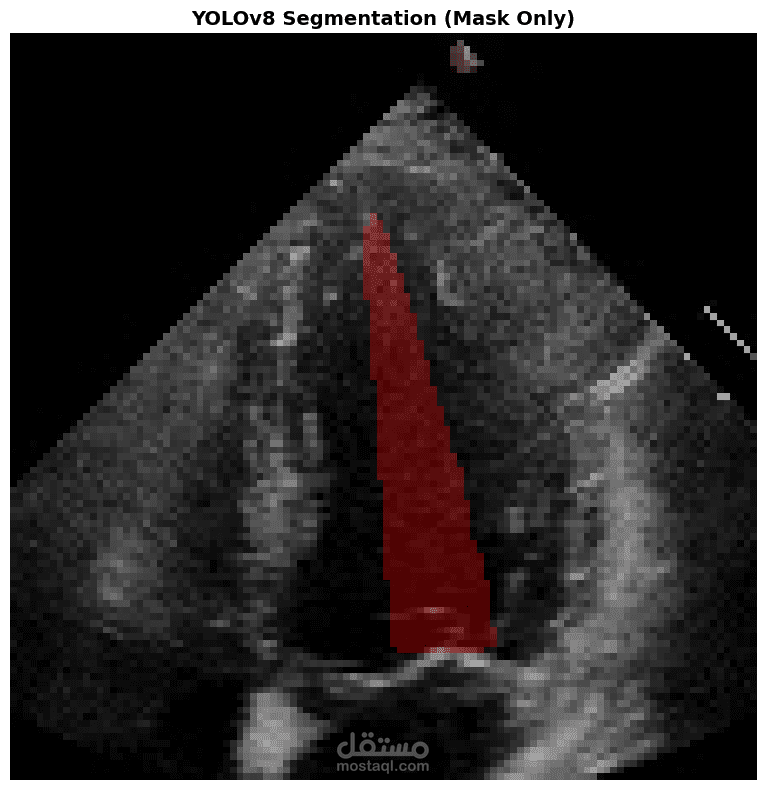
2. Left ventricle segmentation (YOLOv8n-seg) — Trains a YOLOv8 instance segmentation model to detect and outline the left ventricle in each ultrasound frame.
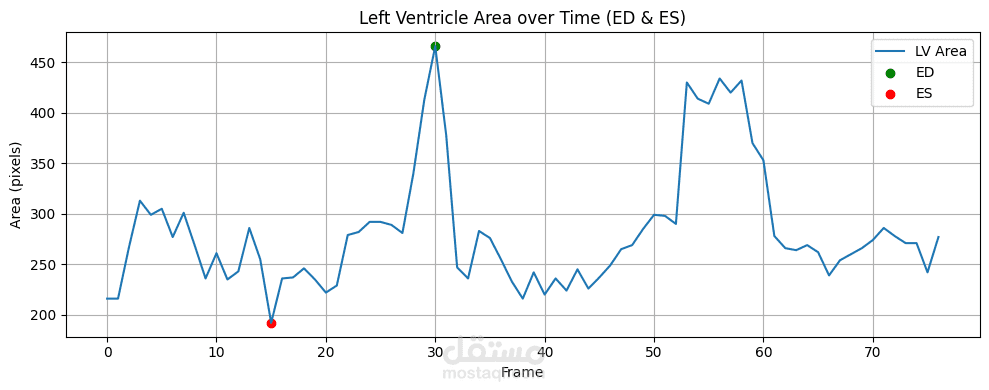
3. Ejection Fraction estimation — Runs the trained model across full video sequences, tracks the left ventricle's mask area frame-by-frame, finds the End-Diastolic (ED, max area) and End-Systolic (ES, min area) frames, and computes:
EF = (ED_area − ES_area) / ED_area
A smoothed/optimized variant adds frame-skipping, mask smoothing, and resizing for speed and stability across all 10,030 videos.
Left ventricle area tracked across a cardiac cycle, with ED and ES frames marked
Left ventricle mask area tracked across a single cardiac cycle — the peak (ED) and trough (ES) frames are auto-detected and used to compute EF for that beat.
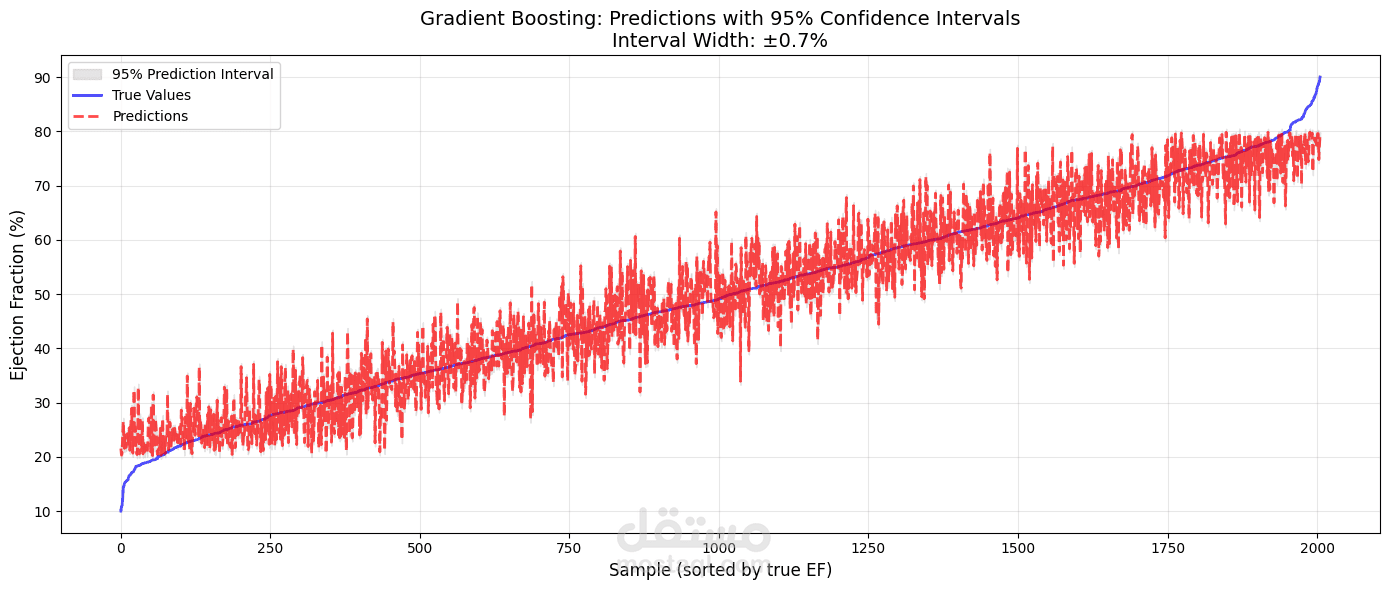
4. ML-based EF prediction — Extracts statistical features from the area-over-time curve (max, min, mean, std, raw EF) and trains multiple regressors — Random Forest, Gradient Boosting, XGBoost, an LSTM, and an ensemble — automatically selecting the best by R².
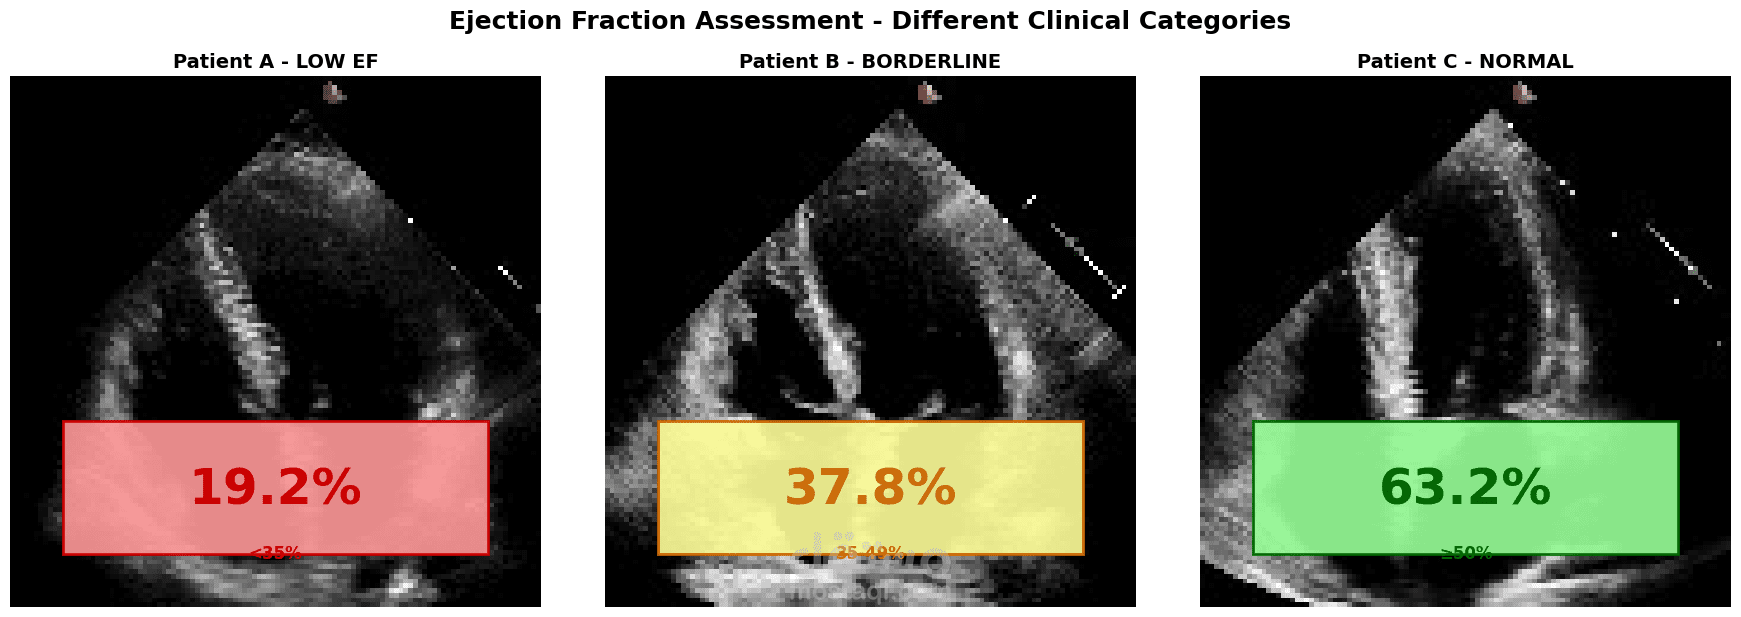
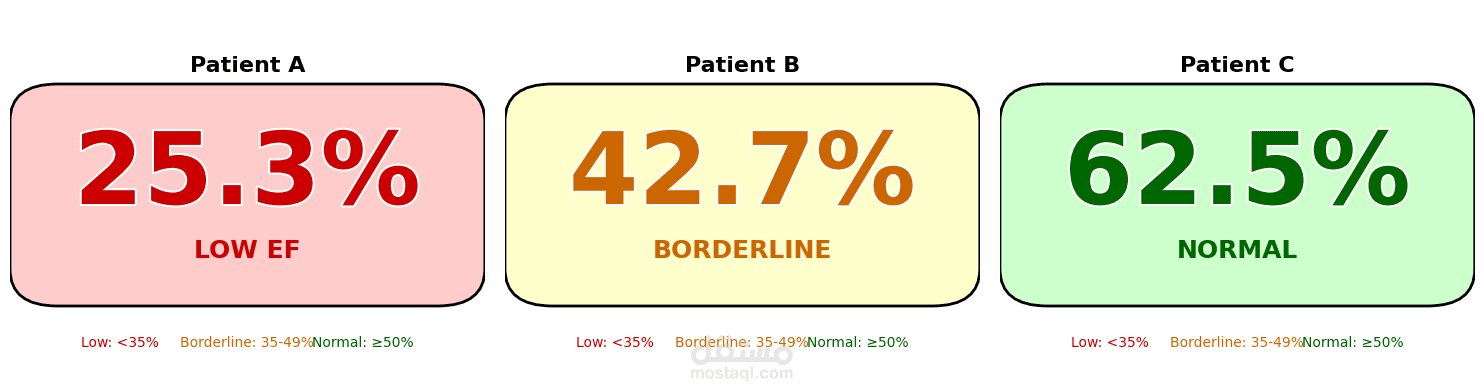
5. Clinical categorization — Classifies each prediction into Low EF (<35%), Borderline (35–50%), or Normal (>50%), with a color-coded display and a suggested follow-up action for each category.
Color-coded EF clinical display