Superstore Sales & Profit Performance Dashboard | Python, Pandas, Plotly, Streamlit
تفاصيل العمل
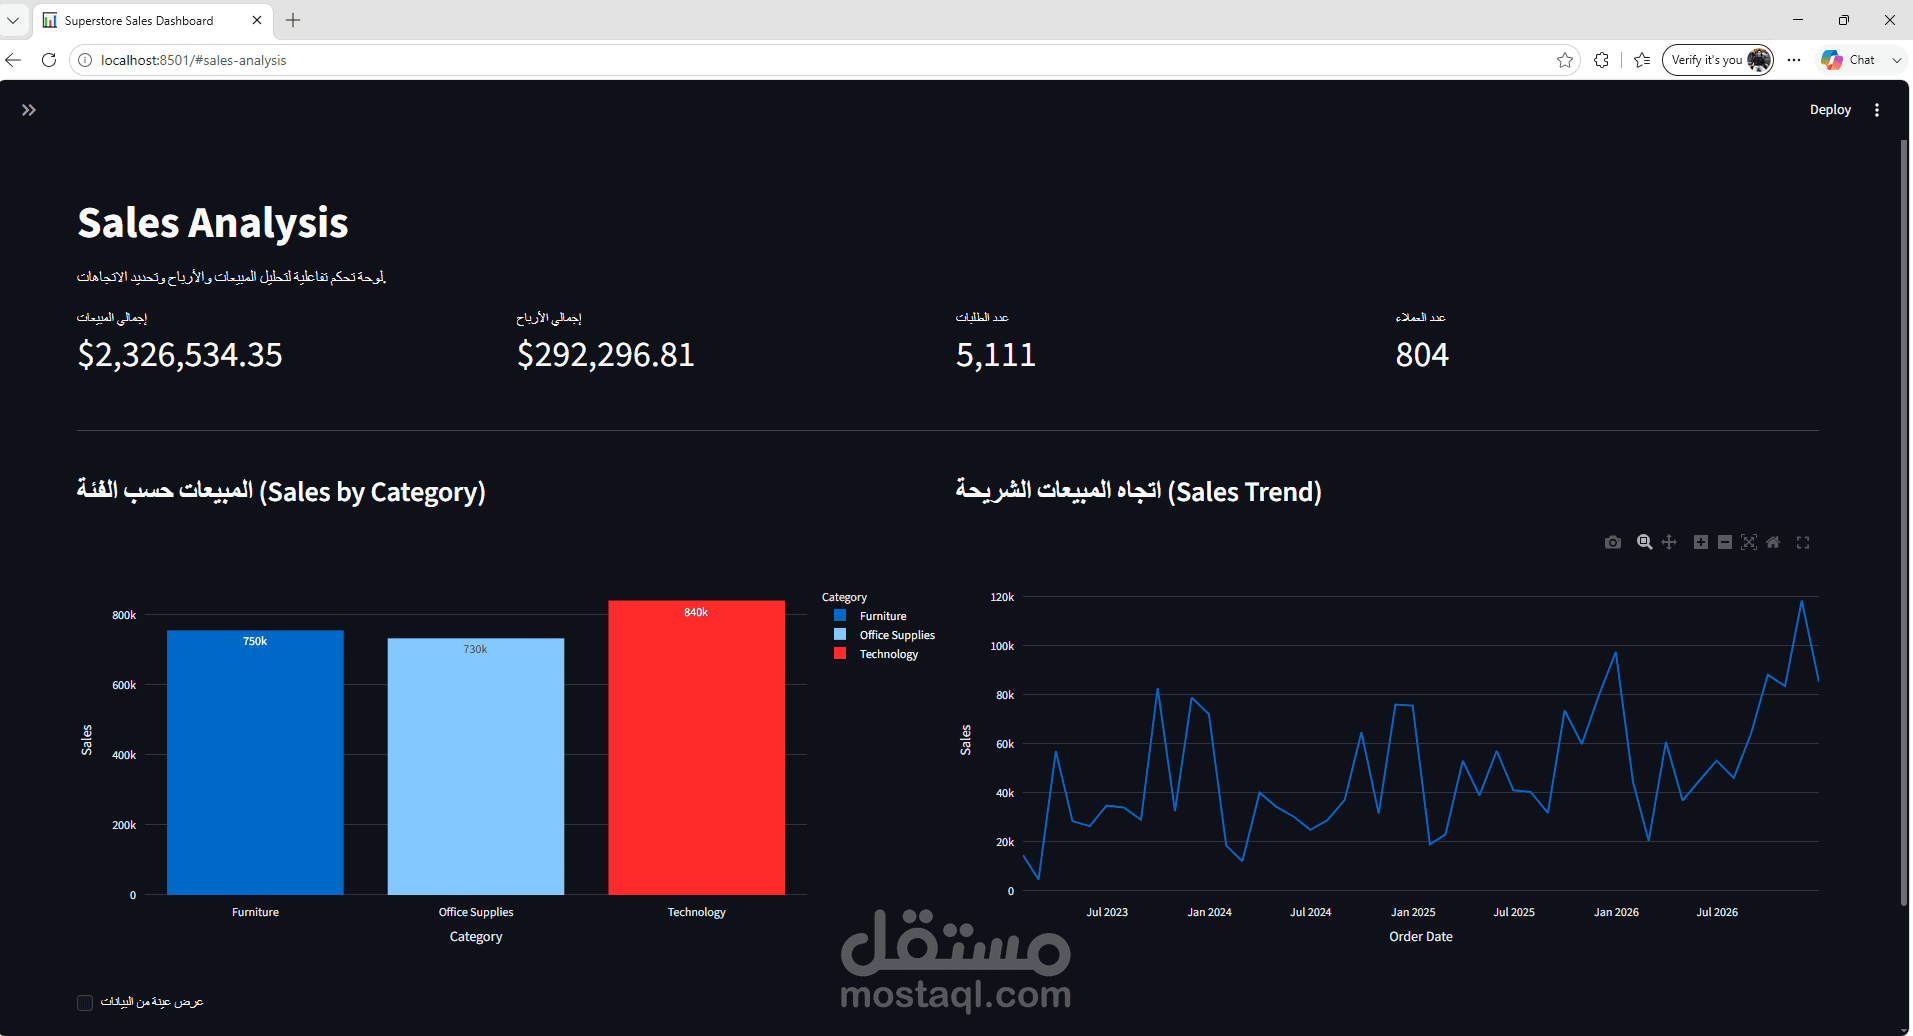
Developed an interactive web application to analyze retail performance, tracking key metrics including total revenue,
profit margins, orders, and customer acquisition.
• Engineered dynamic filtering by Region and Year to enable deep-dive segment analysis and highlight underperforming
markets.
• Built interactive data visualizations using Plotly to display category-wise product distribution and temporal sales trends.