Sales-Dashboard-Project
تفاصيل العمل
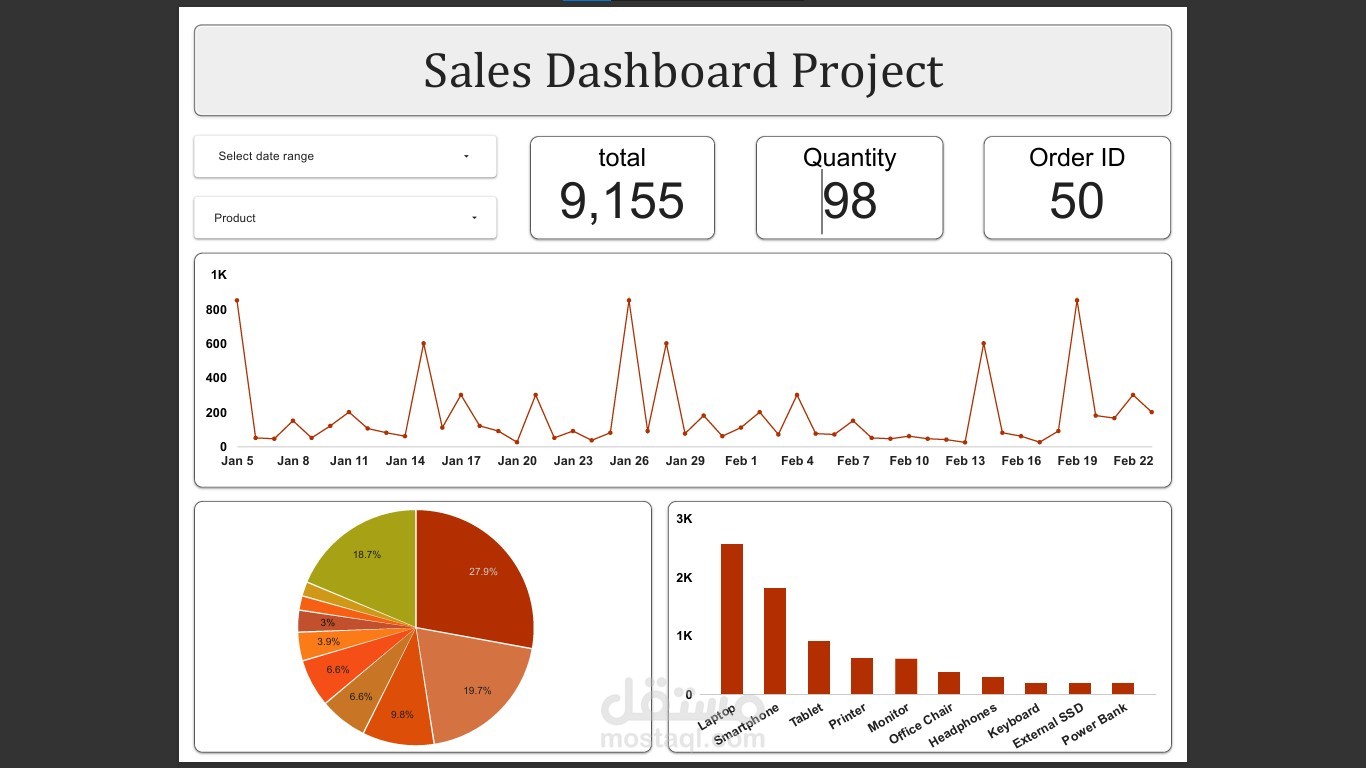
📊 Sales Dashboard Project
Welcome to my sales analysis project! 🚀
🎯 Project Overview
This project visualizes sales data to extract actionable insights. It features a fully automated data pipeline, starting from data collection via Google Forms to visualization in Looker Studio.
🔗 Project Links
Live Dashboard: View Report on Looker Studio
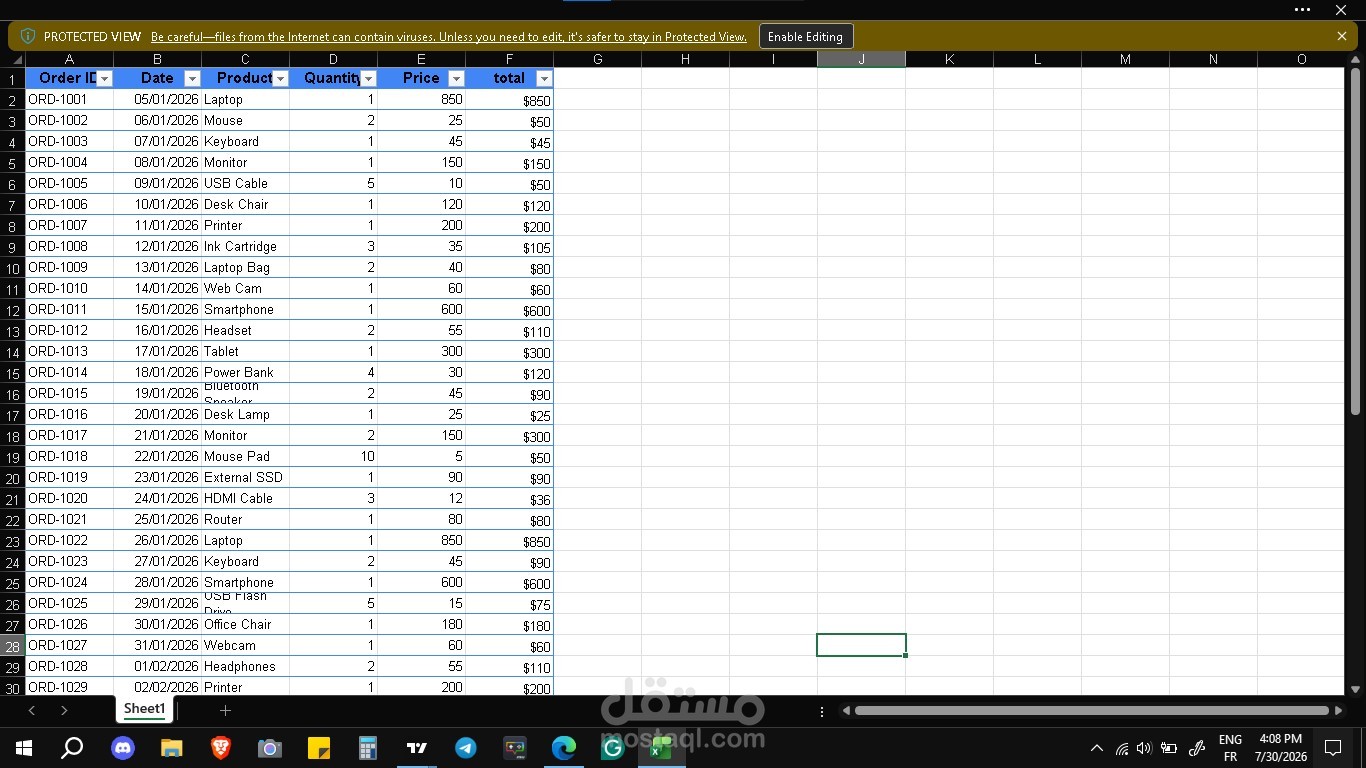
Data Source: Google Sheets (Live Data)
Data Entry Form: Submit Sales Data (Google Form)
📂 Repository Files
Sales_Dashboard_Project.xlsx: Static copy of the project data.
Sales_Dashboard_Project.pdf: Detailed project documentation and analysis report.
⚙️ Data Pipeline
Data Collection: New entries are submitted through the Google Form.
Storage: Data is automatically stored and organized in Google Sheets.
Visualization: Looker Studio connects to the sheet to provide real-time updates and interactive charts.
Tools Used: Google Forms, Google Sheets, Looker Studio, Microsoft Excel.