Cookies Industry Analytics
تفاصيل العمل
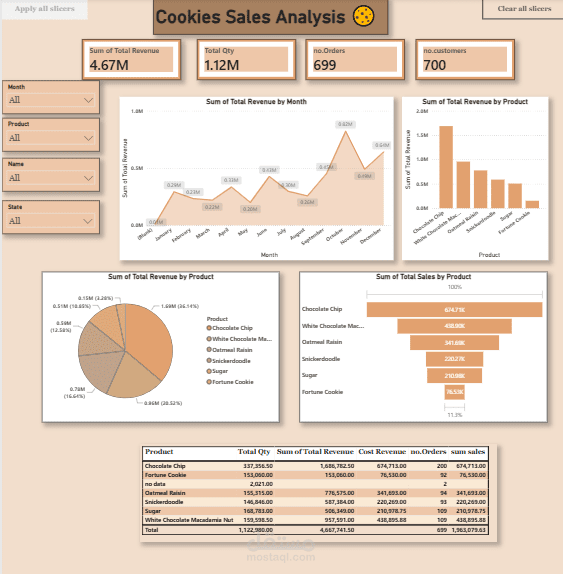
An interactive Power BI dashboard analyzing cookie sales performance across products, months, and regions — tracking $4.67M in total revenue, 1.12M units sold, and 699 orders. Includes trend analysis by month, product-level revenue breakdowns (pie, bar, and funnel charts), and a detailed summary table comparing quantity, revenue, cost, and profit across all six product lines.