Data Analytics Project
تفاصيل العمل
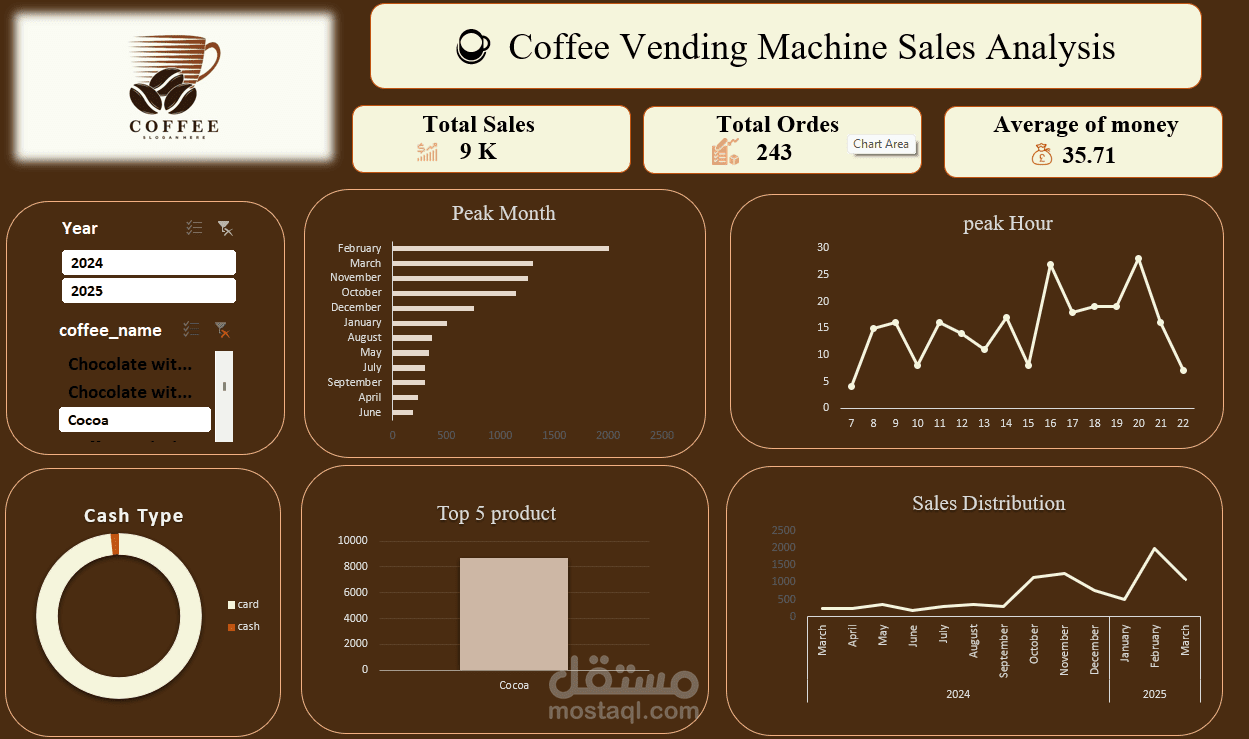
Coffee Vending Machine Sales Analysis - Interactive Dashboard
Designed an end-to-end interactive dashboard to analyze sales performance and customer purchasing behavior for a coffee vending machine business.
Key Highlights:
Core KPIs: Tracked Total Sales (9K), Total Orders (243), and Average Spend per Order (35.71).
Peak Analysis: Identified peak operating hours (highest demand between 16:00 and 20:00) and peak sales months (led by February).
Product & Payment Breakdown: Analyzed top-performing beverages (like Cocoa) and categorized revenue by payment methods (Card vs. Cash).
Time Series Trends: Visualized month-over-month sales distribution across 2024 and 2025.
Interactivity: Integrated dynamic slicers for Year and Coffee Name for seamless data exploration.