Mexico Toy Sales Dashboard
تفاصيل العمل
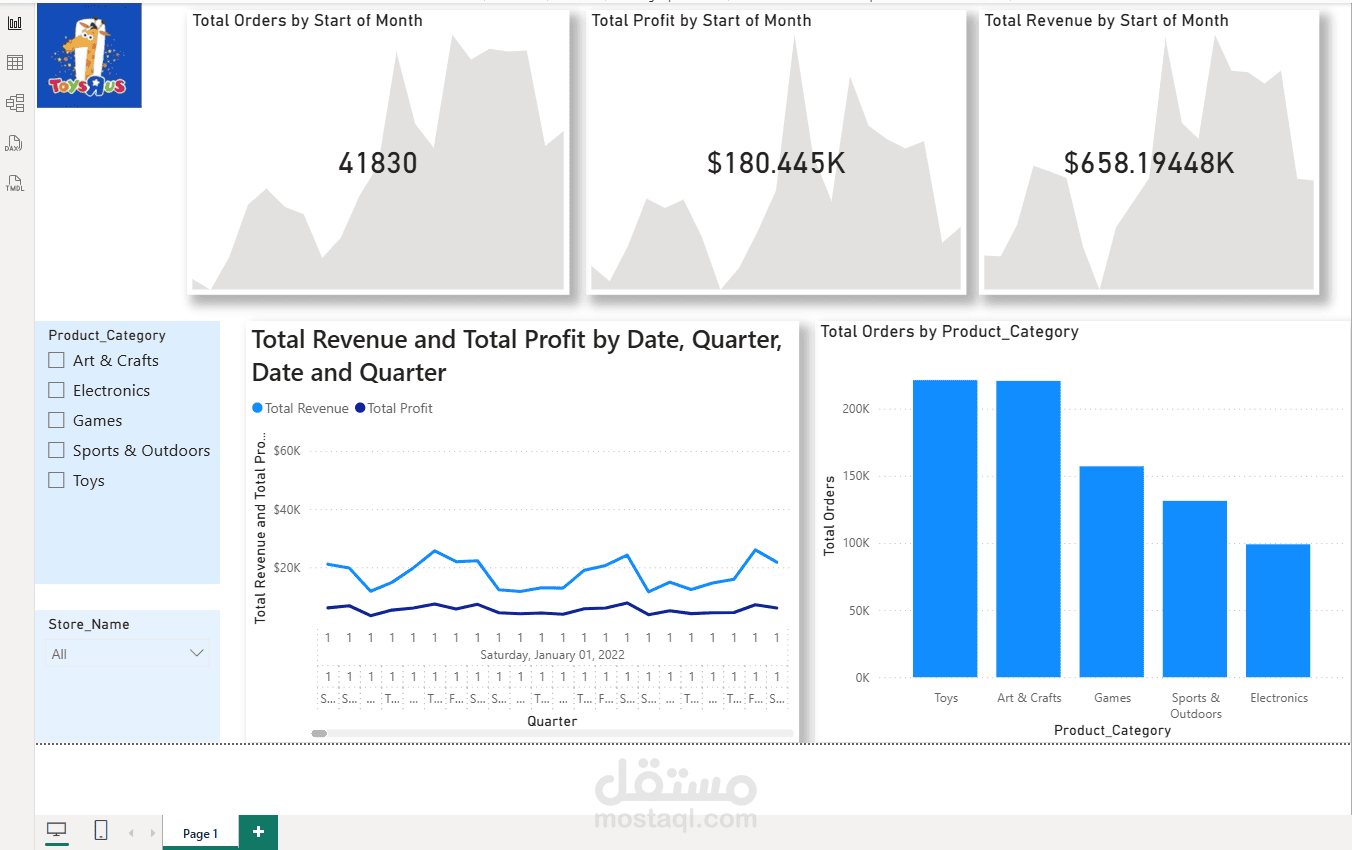
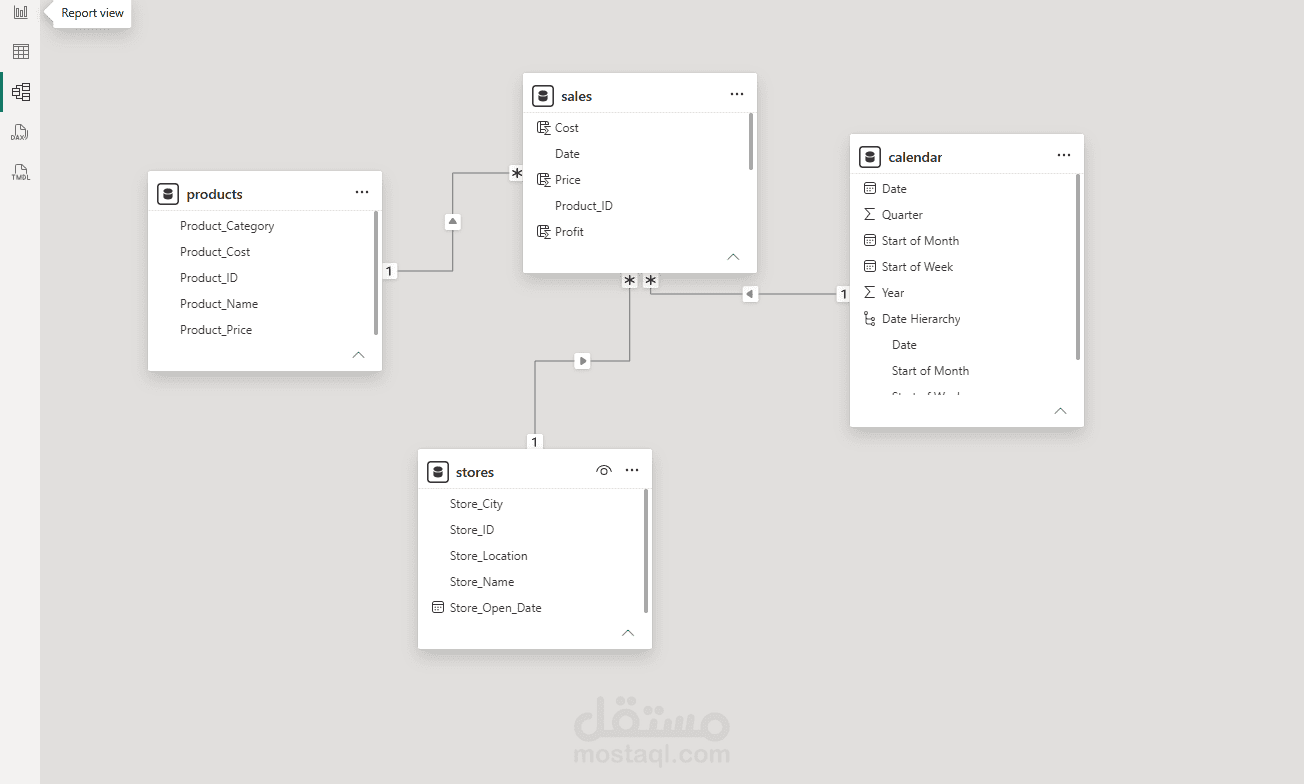
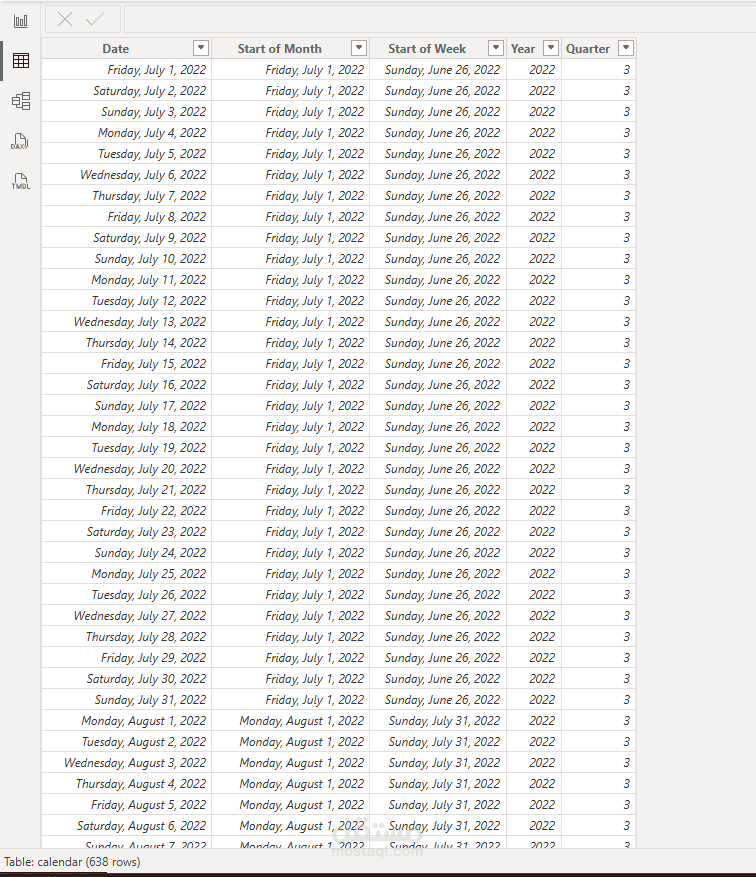
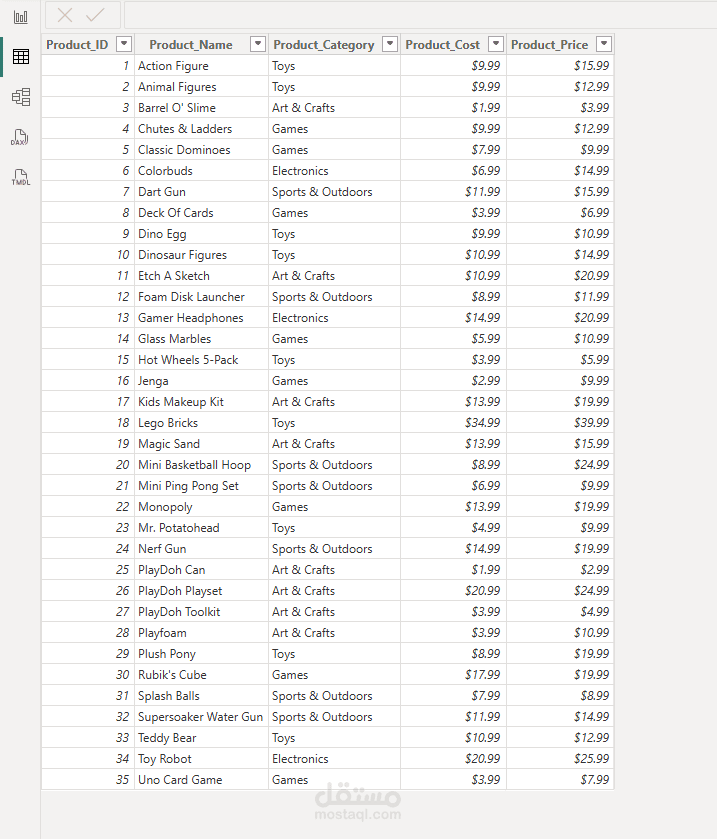
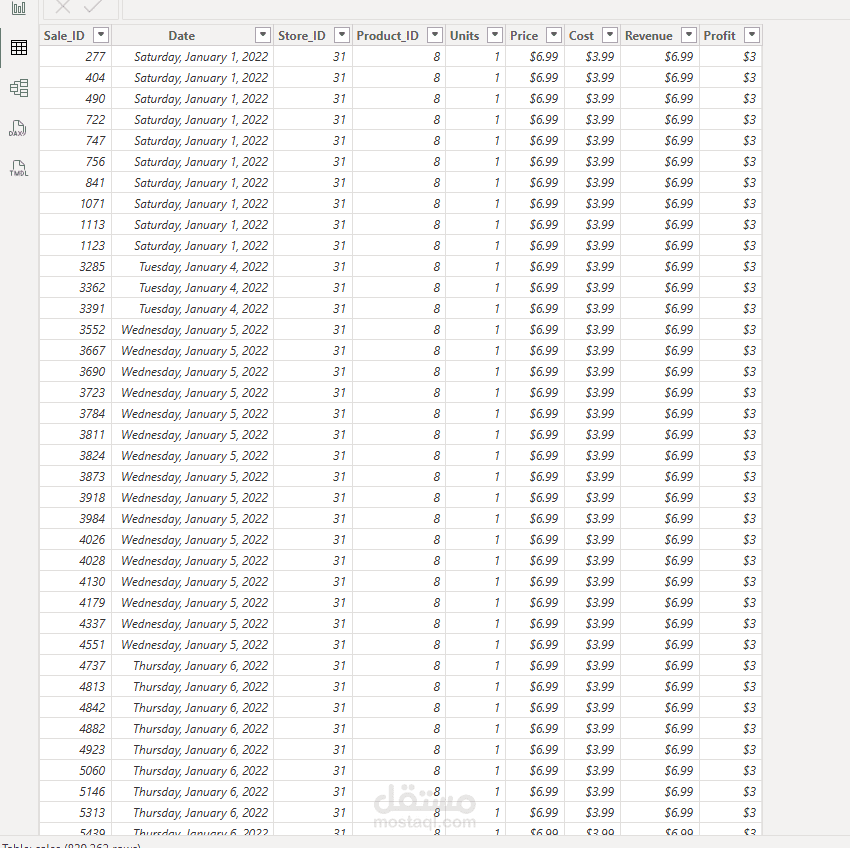
Developed an interactive Power BI dashboard to analyze toy sales data across different regions, products, and time periods. The dashboard includes key performance indicators (KPIs), sales trends, profit analysis, top-performing products, and regional comparisons. Used Power BI, DAX, and data visualization techniques to provide clear business insights and support data-driven decision-making.