Coffee Sales Analysis Dashboard in Microsoft Excel
تفاصيل العمل
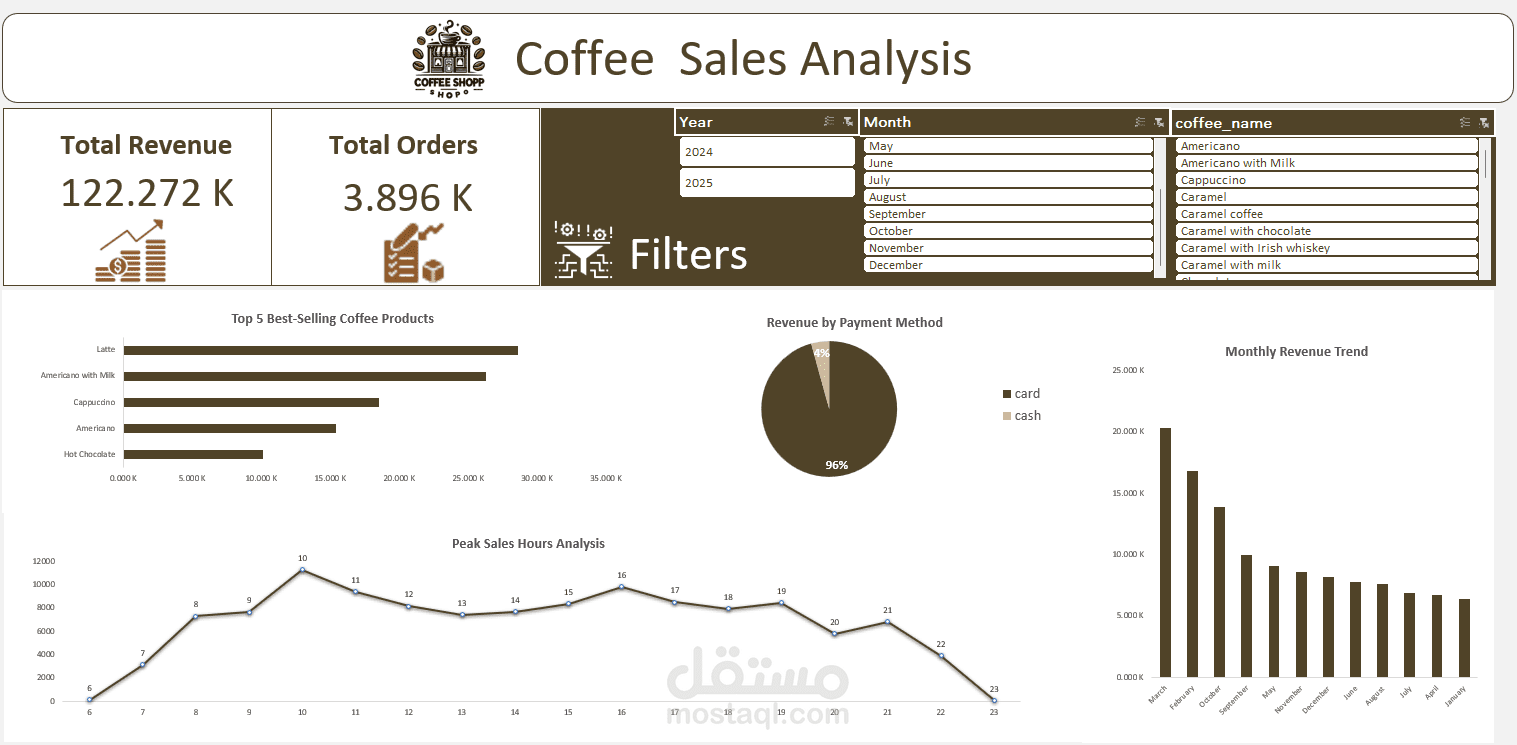
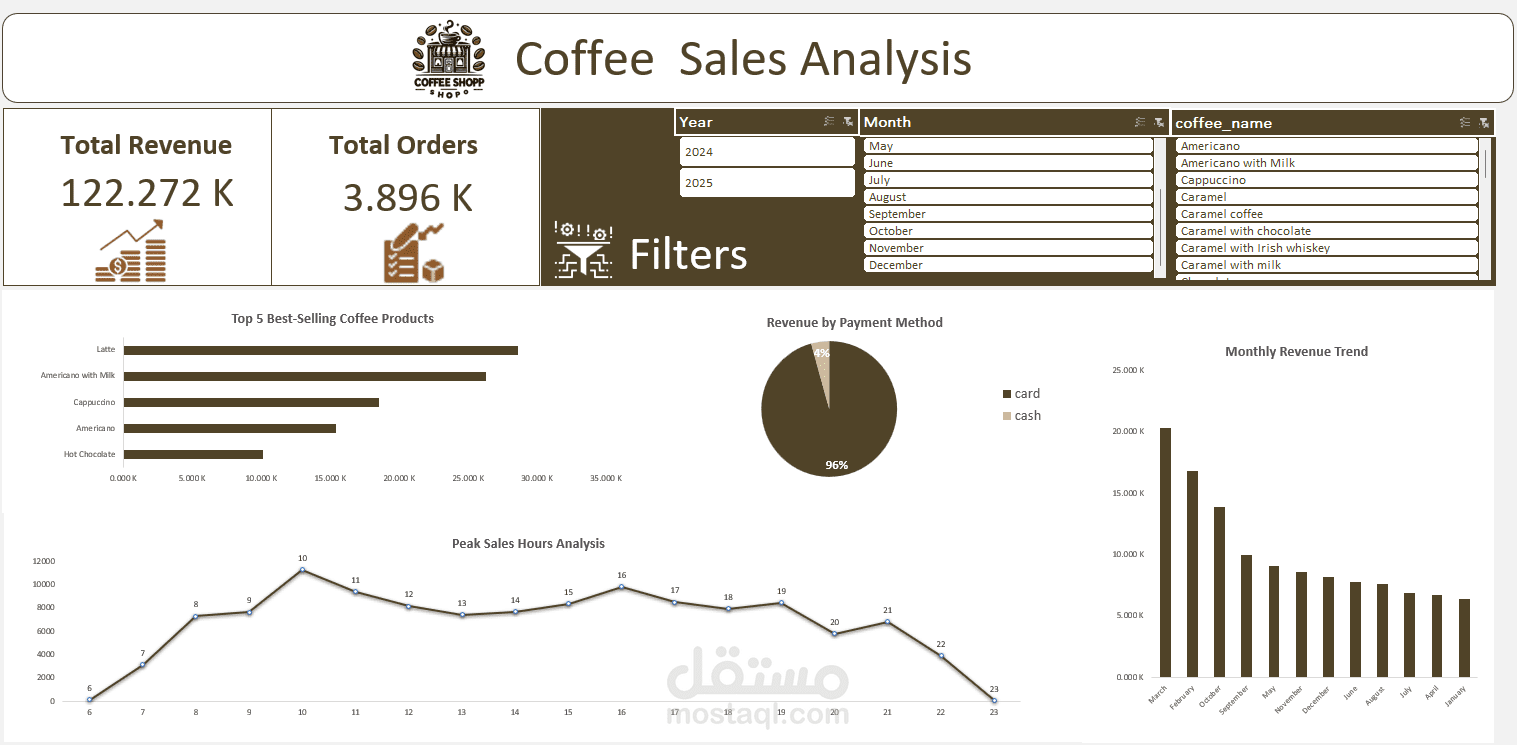
Designed and developed an interactive Coffee Sales Dashboard in Microsoft Excel to analyze sales performance and uncover valuable business insights.
Dashboard Features:
Total Revenue and Total Orders KPIs.
Top 5 Best-Selling Coffee Products.
Revenue Analysis by Payment Method.
Monthly Revenue Trend.
Peak Sales Hours Analysis.
Interactive filters for Year, Month, and Coffee Products.
Tools & Techniques:
Microsoft Excel
Pivot Tables
Pivot Charts
Slicers
Dashboard Design
Data Visualization
This dashboard enables users to track coffee shop performance, analyze customer purchasing behavior, identify top-selling products, and monitor revenue trends through an intuitive and interactive interface.